
Myth Busting · Episode 06
The "BEST MACD Trading Strategy [86% Win Rate]", Tested: 38%, and a Coin Flip Finished Ahead
TL;DR: A video with more than 4.5 million views promises an 86% win rate from a MACD cross, a 200 EMA and a support test. With a target of 1.5 times the risk, the strategy needs 40% just to break even. On Ethereum 15-minute candles over the 5 years after the video, the rules won 38.0% of 1,146 trades (95% interval 35.2–40.8%) and lost 58.5R before costs. Random directions on the same entries, with the same stops and targets, did better 87% of the time. The support filter removed a third of the trades and left the win rate at exactly 38.0%. Script, data notes and every run are below.
The claim
The video is TradingLab’s BEST MACD Trading Strategy [86% Win Rate], published October 3, 2021. The 86% is in the title. The video itself teaches the rules clearly, step by step, on 15-minute crypto charts, and it is careful in places: it warns that a level that held once “doesn’t mean that it will always do that again” (6:16).
We test trading claims the same way every time: write the rules down before any test, turn them into code, run them on fixed data and keep every result. For this episode the test plan was registered on November 6, 2026, 21:02 UTC, before a single strategy run, and its SHA-256 hash was recorded. Later amendments are marked as such in the research record.
What 86% would mean
The strategy risks 1 to make 1.5. At 86%, almost every trade would pay more than it risked. To break even it only needs 1 ÷ (1 + 1.5) = 40%. So the question is simple: does it win more than 40% of its trades, and does it beat chance?
The rules
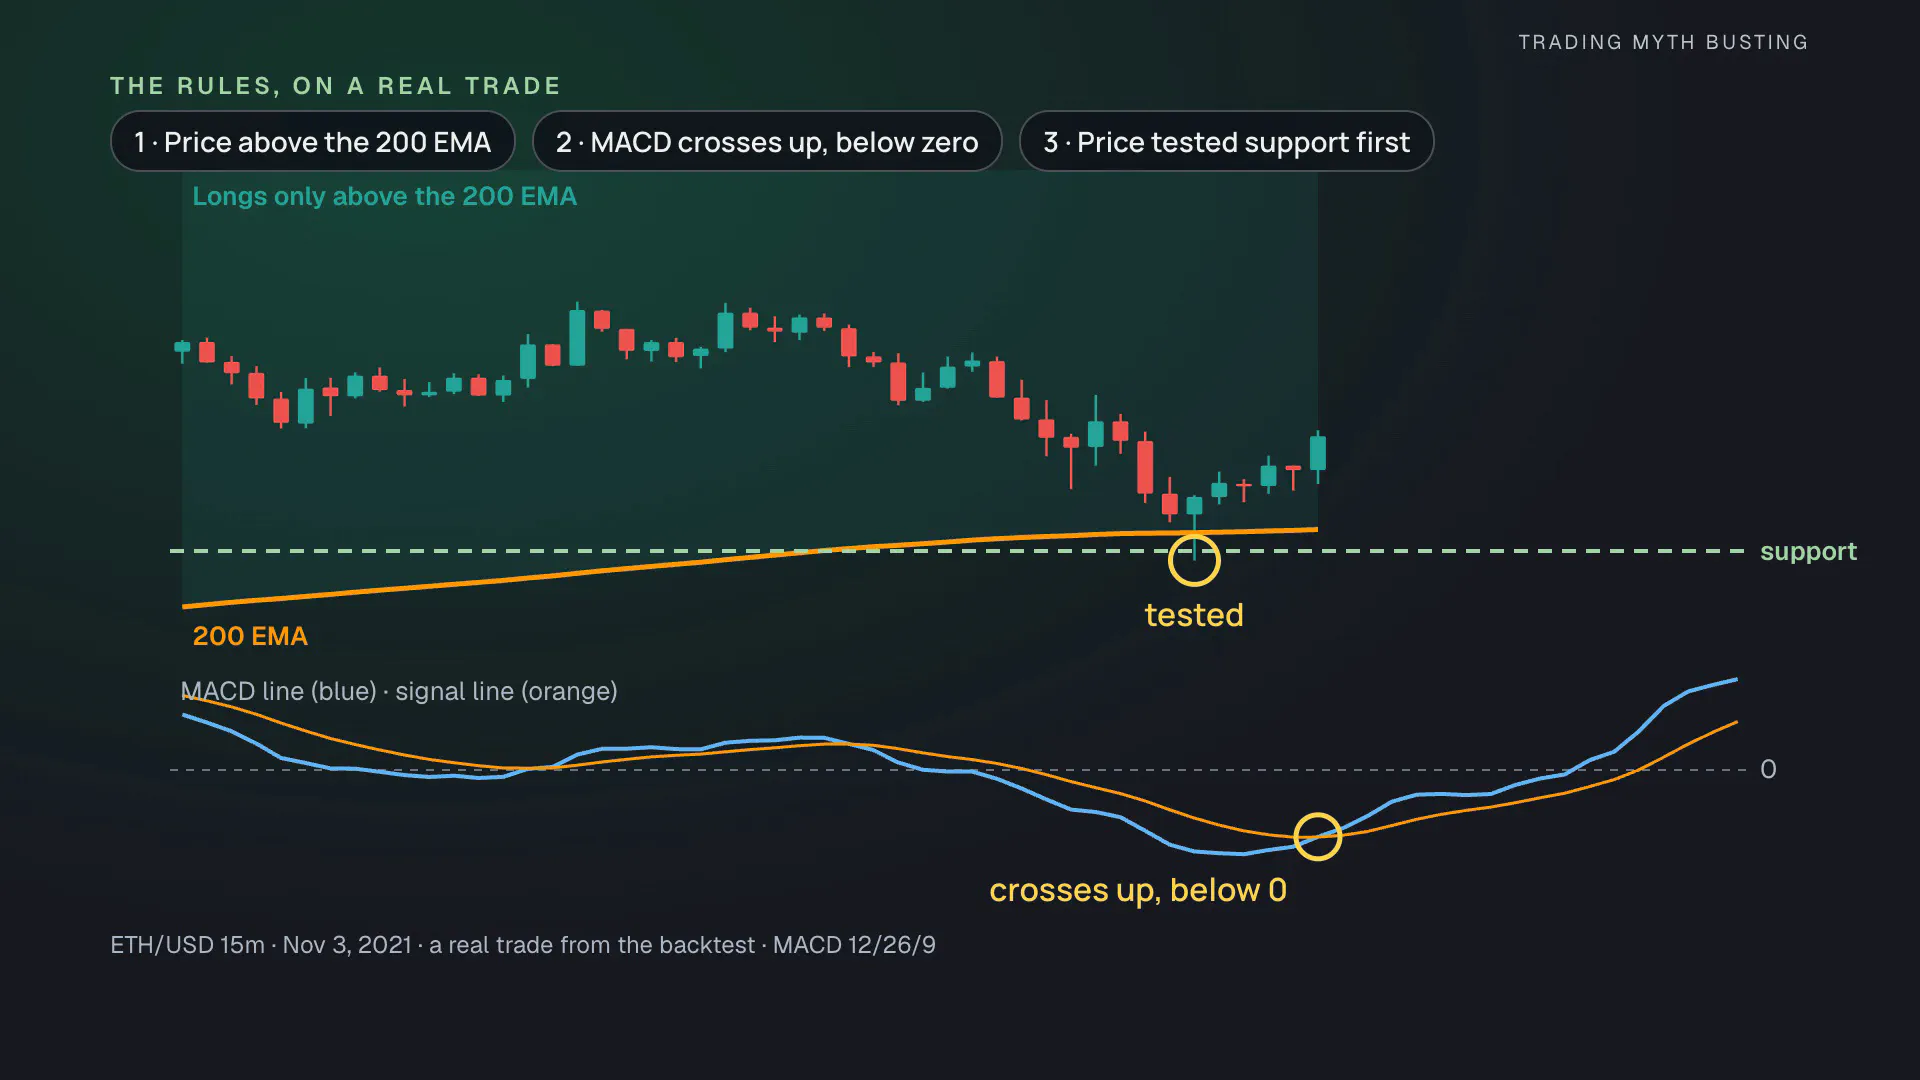
Three filters, in this order:
- Trend: longs only above the 200 EMA, shorts only below it.
- Support: before the signal, price has come back to a support level (a resistance level for a short).
- MACD: the MACD line crosses up through its signal line while it is still below zero (down while above zero for a short).
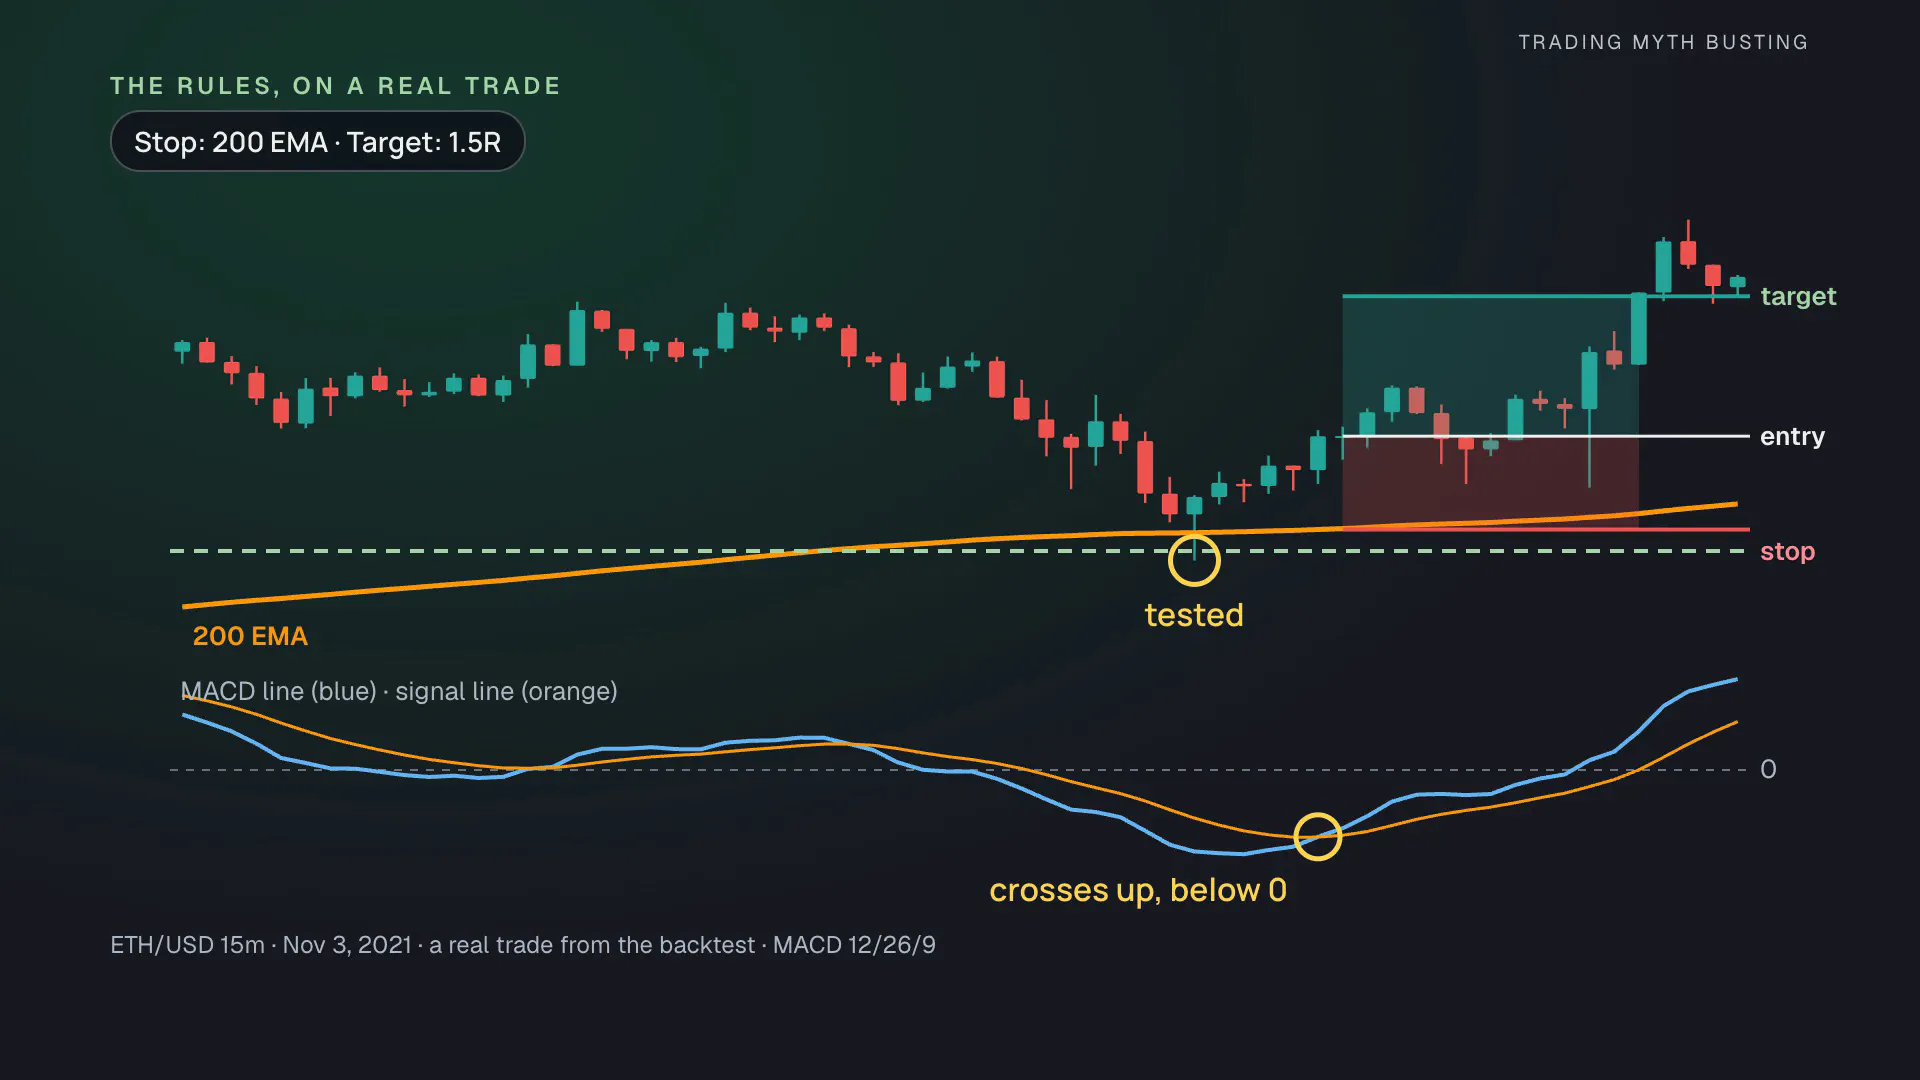
The entry is at the next candle’s open. The stop goes at the 200 EMA, and the target is 1.5 times the risk.
In the script, the setup is two lines:
bool longSetup = bullCross and macdLine < 0 and upTrend
bool shortSetup = bearCross and macdLine > 0 and downTrend
The video never says what makes a level “key”, so we turned it into a rule. Our support and resistance levels come from AutoSRZones, a small public library we wrote: a level starts only at a turning point that stood out by at least 10 times the average true range. The gate is one import and one condition:
import PyneSys/AutoSRZones/1 as sr

bool longSignal = longSetup and (not useSupportResistance or supportGate) and tradeDirection != "Short only"
Where the video leaves room, the plan fixes the details: the 200 EMA is on the chart’s own timeframe, as the video’s charts show (the narration says “200 day”); “below zero” is checked on the candle of the cross; the support test must happen on or after the previous opposite MACD cross; one position at a time.
We gave it $1,000
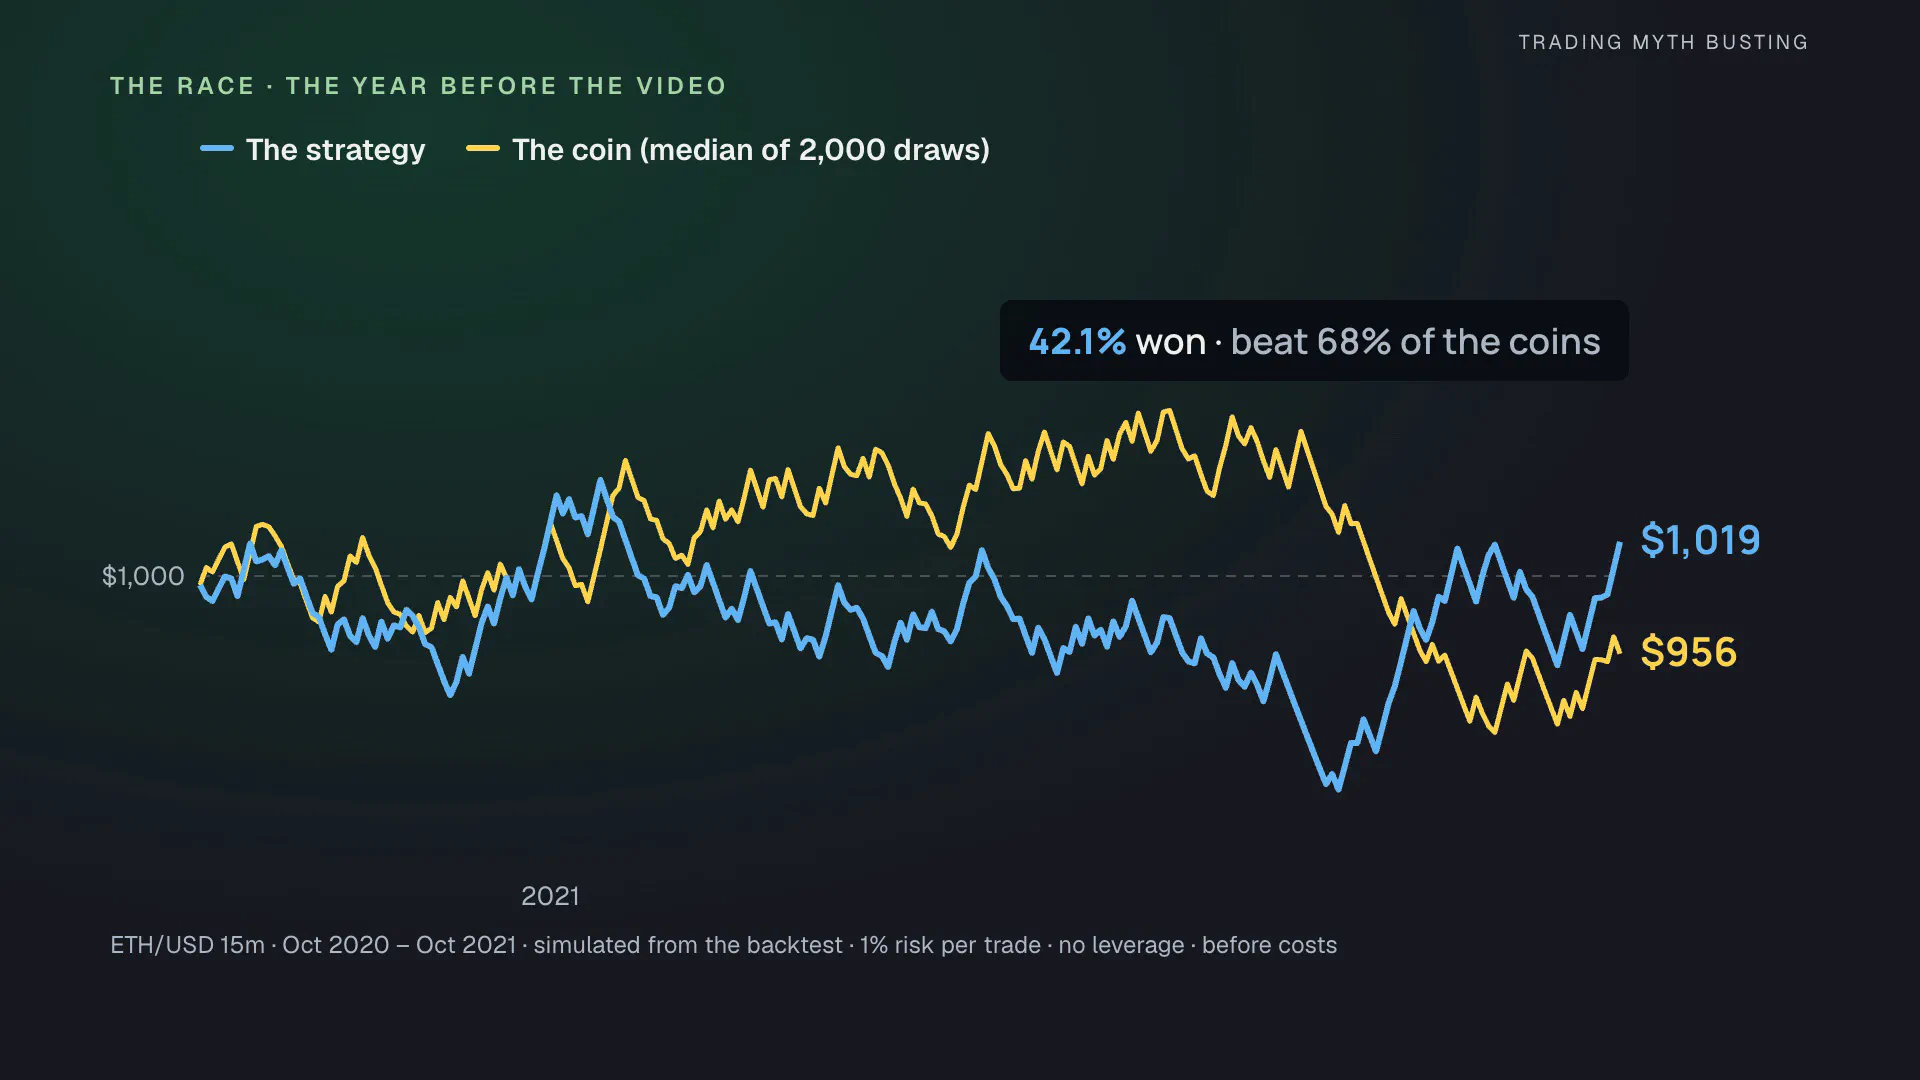
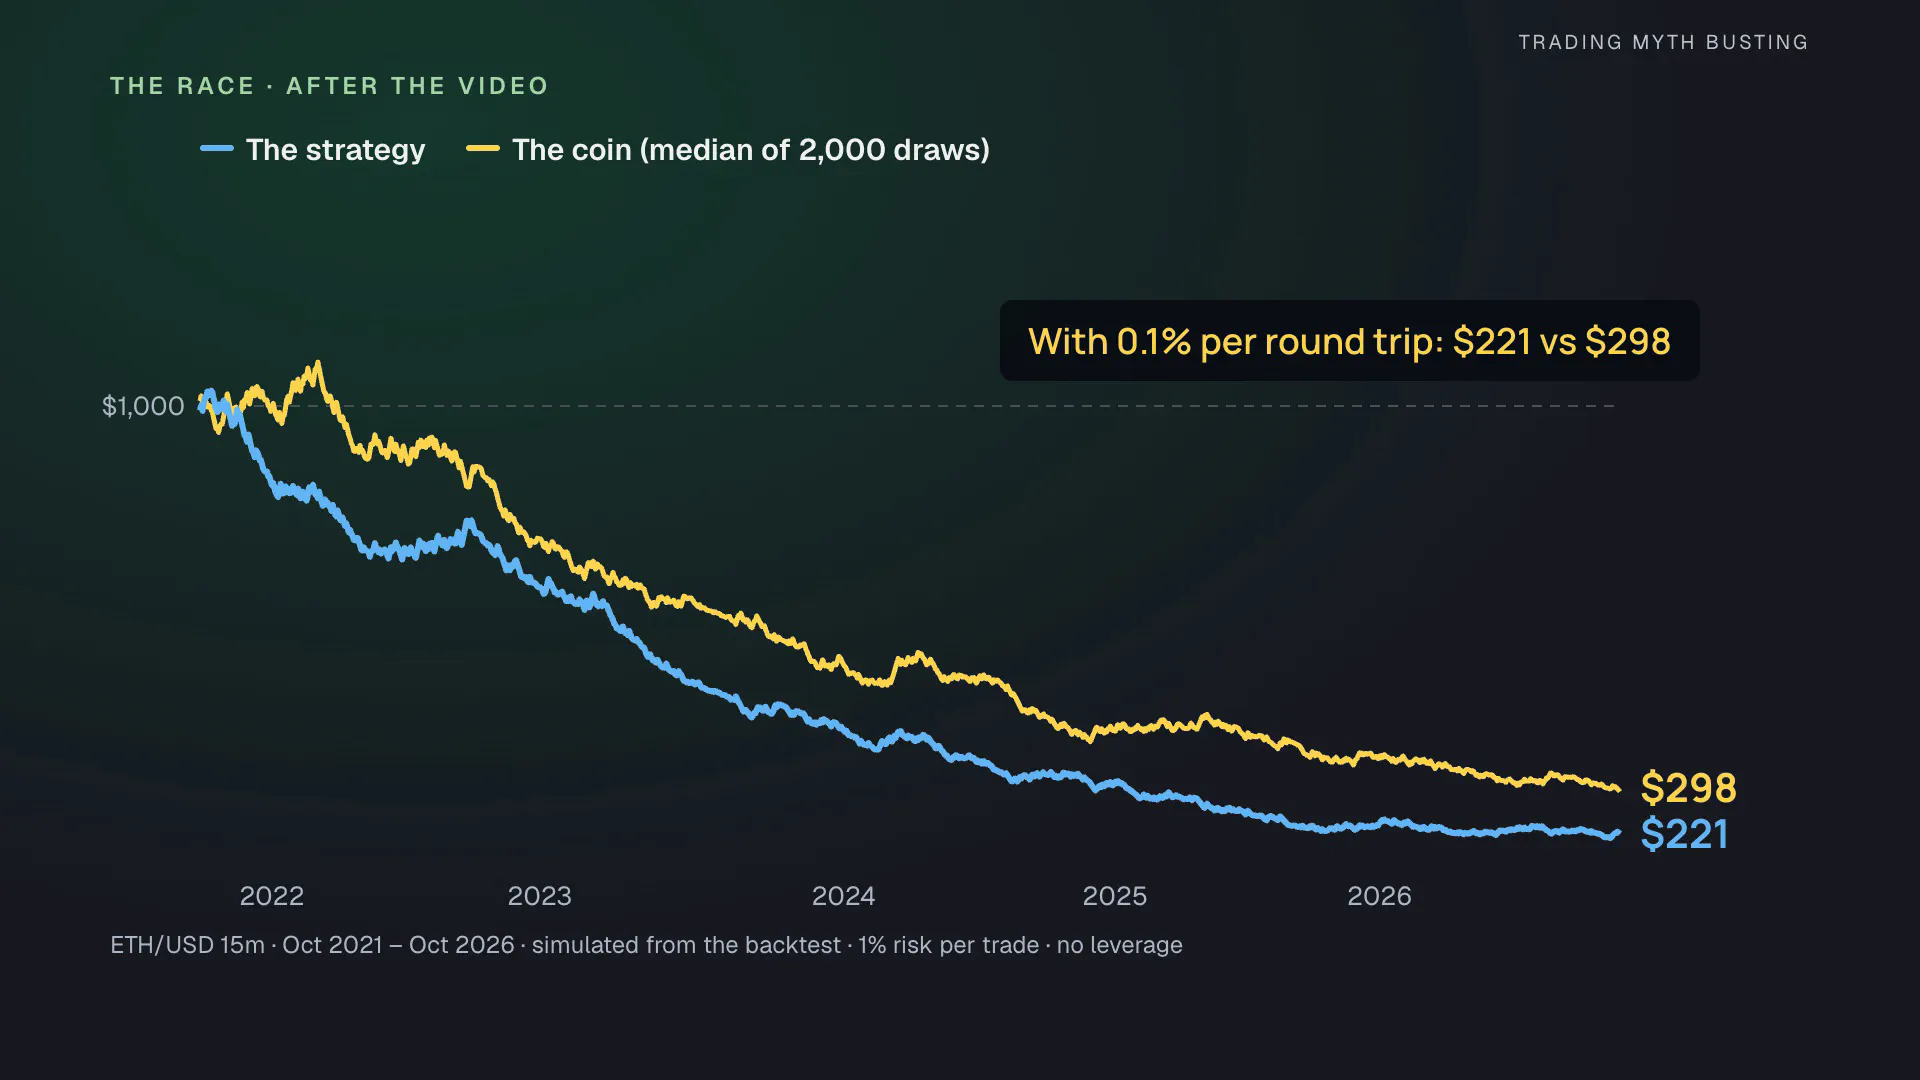
To make the result visible we gave the strategy a simulated $1,000 account, and gave another $1,000 to a coin. The coin takes the same entries, with the same stop and target distances, and only picks the direction. Both accounts risk 1% per trade, without leverage, and the coin’s curve is the median of 2,000 draws.
The year before the video looked promising: on Ethereum 15-minute candles, October 2020 to October 2021, the strategy won 42.1% of 228 trades and finished the year at $1,019, ahead of the coin’s $956. Only 32% of the coin draws did better. If you had tested it back then, you might have believed it.
Then the video came out. The strategy took an early lead that lasted 2 months. By December 2021 the coin was in front, and it never gave the lead back. Over the 5 years after the video (October 4, 2021 to October 31, 2026) the strategy won 38.0% of 1,146 trades, and the account ended at $582. The coin’s median curve ended at $783, and the coin did better in 85% of its draws.
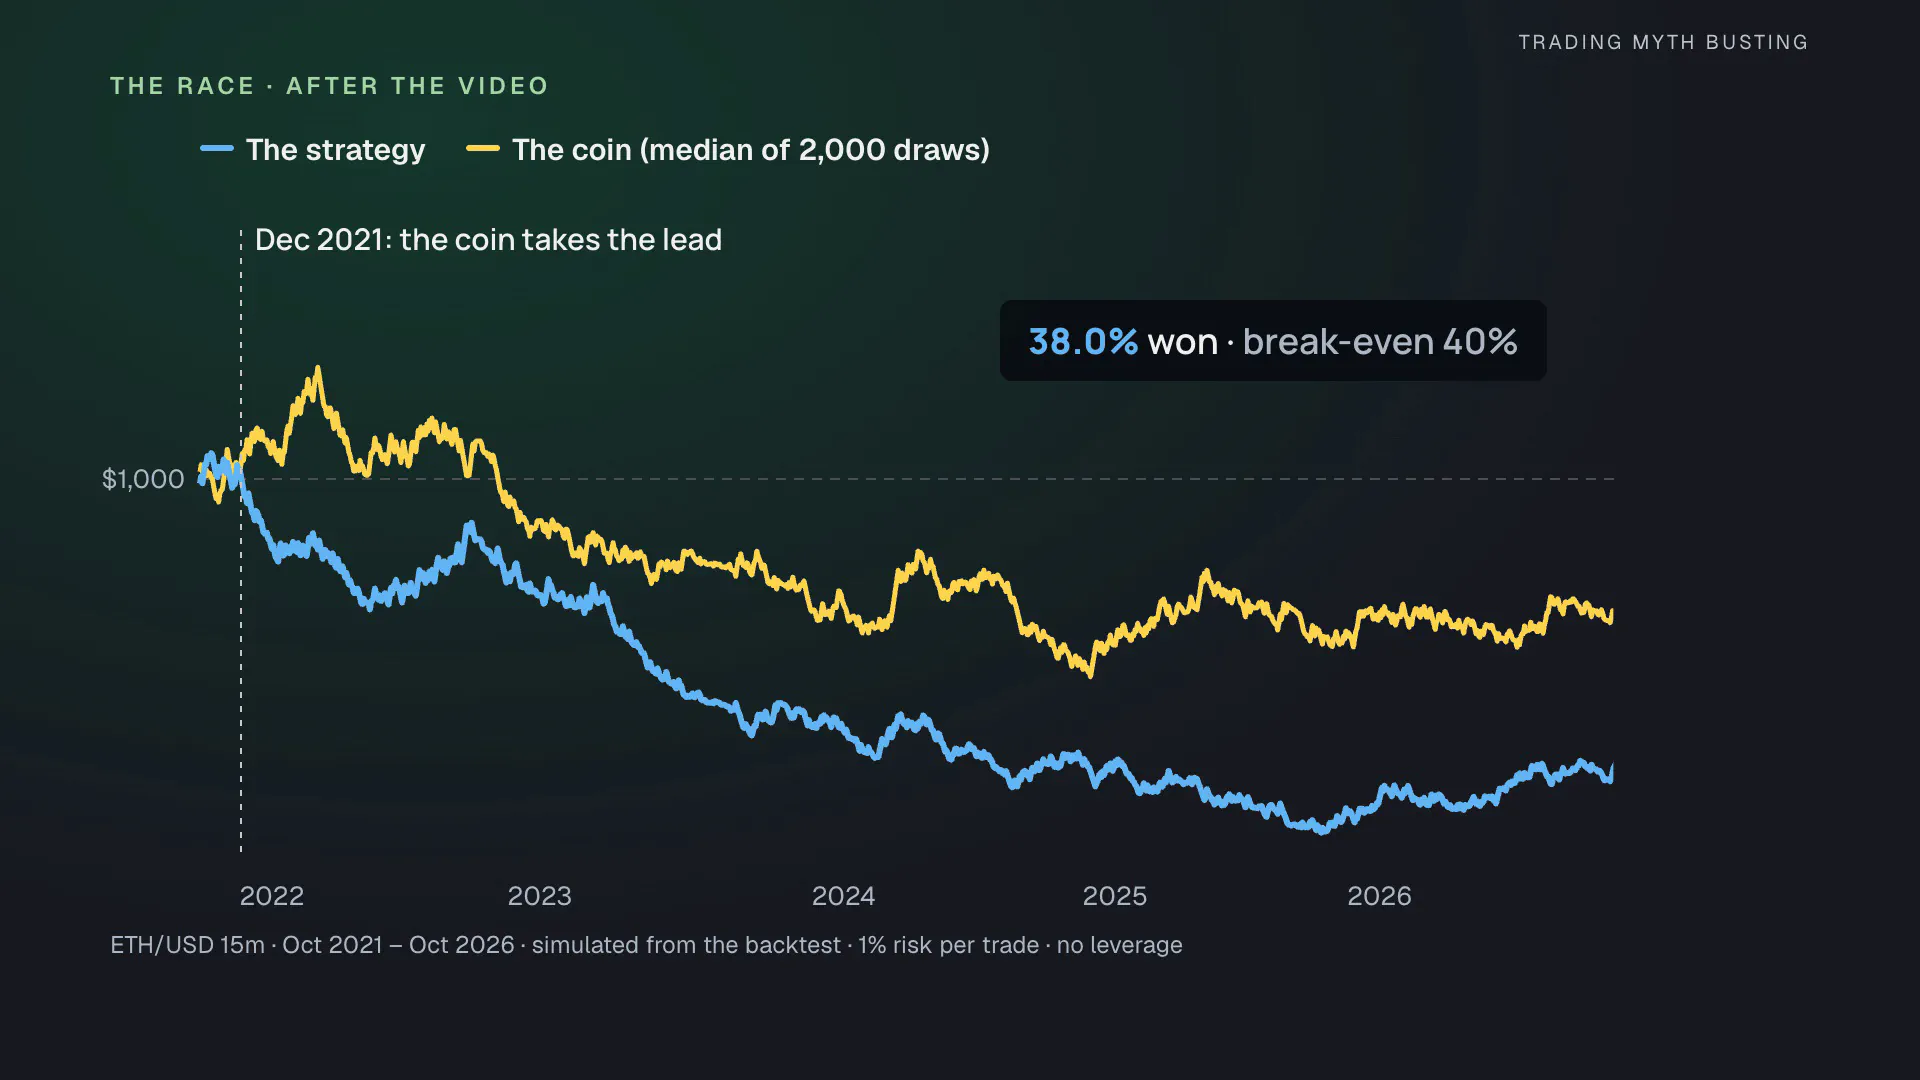
That is before costs. With a cost of 0.1% per round trip, both accounts sink: the strategy ends at $221, the coin at $298. Costs hit this strategy hard because the stop sits at the 200 EMA, which is sometimes very close to the entry; a quarter of the Ethereum trades risked less than 0.25% of the price.
The coin flip, two ways
Our first coin flip is a script we wrote: 10,000 draws on the same entries, with the same stop and target distances and a random direction. The real rules came out at −58.5R, at the 13th percentile. Random directions did better 87% of the time.
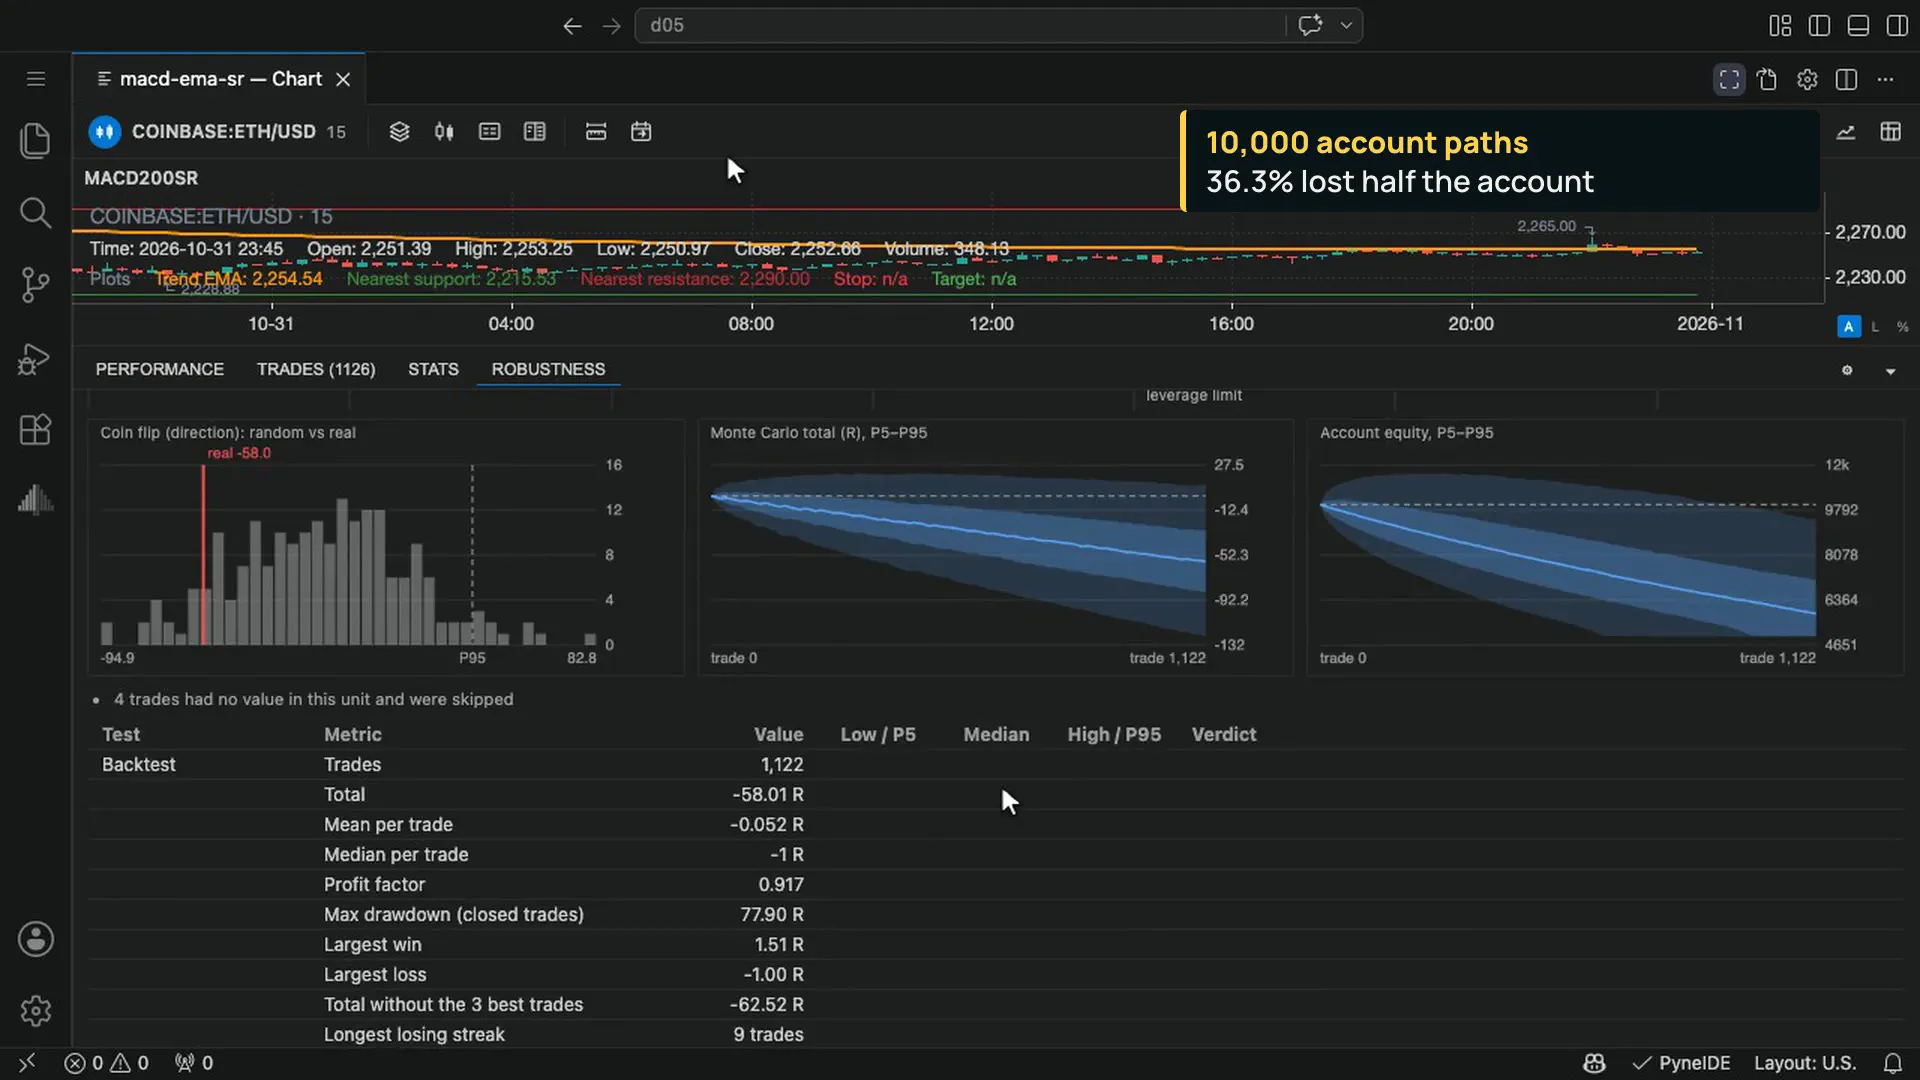
We asked the Robustness tab in PyneIDE the same question. It reruns the full backtest of the script 200 times, each time with random directions, and 91.5% of the runs did better than the real rules. It also replays the trades 10,000 times in a different order: starting from $10,000 with 1% risk per trade and no leverage, the account fell to half or less in 36.3% of those paths.
Does the support filter help?
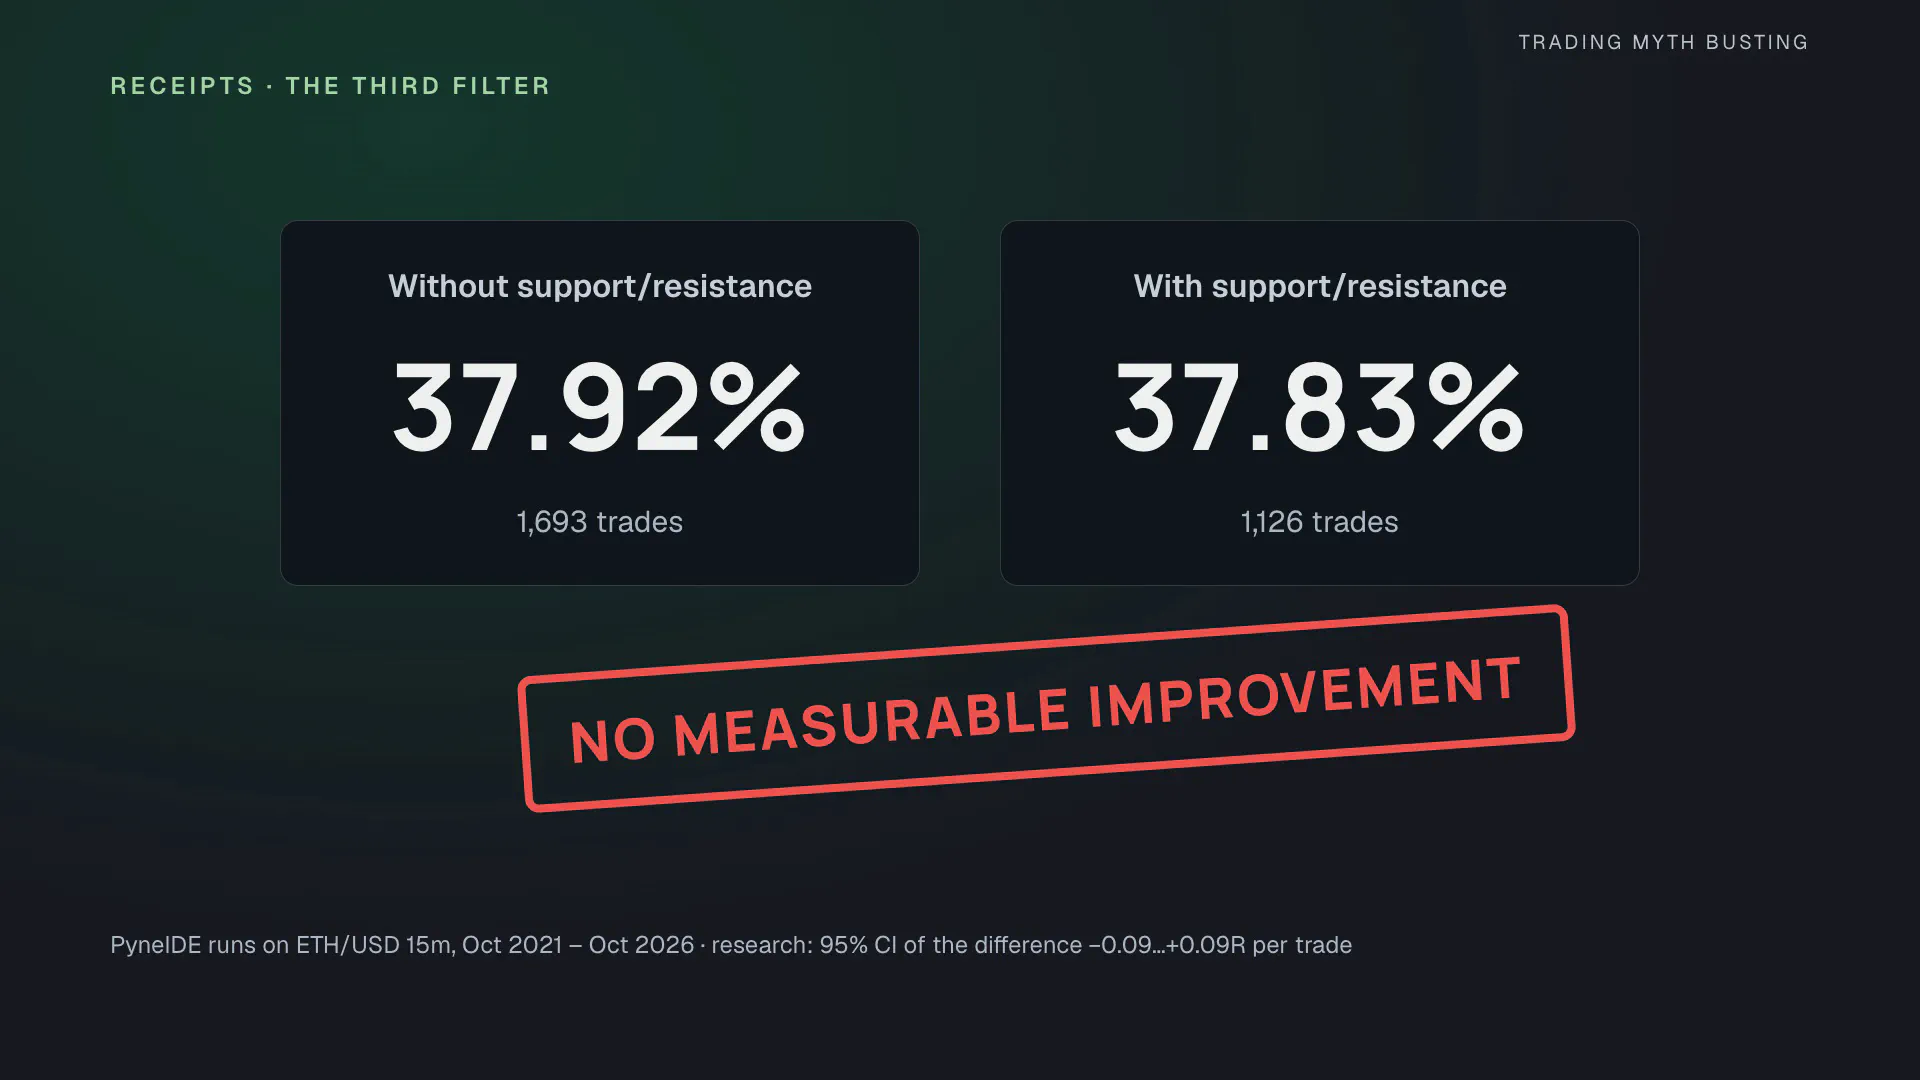
The video says the support and resistance test is what makes the strategy work and gives it “an extremely high win rate” (6:41). So we switched it off. In PyneIDE, on the same Ethereum data, the strategy without the filter won 37.92% of 1,693 trades; with the filter, 37.83% of 1,126. In the registered research (the version of the script the plan ran) the numbers are 38.0% of 1,701 and 38.0% of 1,146.
The filter turned away a third of the trades. The win rate didn’t notice. The difference in average R per trade is −0.002R, with a 95% interval of −0.092 to +0.088R. Across all 13 tests below, no row shows a measurable improvement: every interval includes zero.
Trying to make it work
The creator says in the comments that it works on basically every timeframe, and that higher timeframes are more reliable. So we tried: Ethereum, bitcoin and Algorand on 15-minute, 1-hour and 4-hour candles, then gold, EUR/USD, the Nasdaq 100 and the Dow on 15-minute candles. 13 tests, all with the default rules, all after the video.
| Test | Trades | Win rate | 95% interval | Before costs | Coin-flip percentile |
|---|---|---|---|---|---|
| Ethereum 15m | 1,146 | 38.0% | 35.2–40.8% | −58.5R | 13th |
| Ethereum 1h | 243 | 37.4% | 31.6–43.7% | −15.5R | 29th |
| Ethereum 4h | 62 | 37.1% | 26.2–49.5% | −4.5R | 24th |
| Bitcoin 15m | 1,140 | 42.0% | 39.2–44.9% | +57.5R | 86th |
| Bitcoin 1h | 252 | 42.1% | 36.1–48.2% | +13.0R | 56th |
| Bitcoin 4h | 66 | 43.9% | 32.6–55.9% | +6.5R | 66th |
| Algorand 15m | 1,216 | 40.2% | 37.5–43.0% | +4.4R | 56th |
| Algorand 1h | 268 | 42.5% | 36.8–48.5% | +17.0R | 54th |
| Algorand 4h | 68 | 51.5% | 39.8–62.9% | +19.5R | 99th |
| Gold 15m | 389 | 43.7% | 38.9–48.7% | +35.8R | 80th |
| EUR/USD 15m | 526 | 36.3% | 32.3–40.5% | −50.3R | 2nd |
| Nasdaq 100 15m | 467 | 40.9% | 36.5–45.4% | +9.8R | 47th |
| Dow 15m | 517 | 36.8% | 32.7–41.0% | −48.0R | 1st |
None came close to 86%: the highest upper bound of any interval is 62.9%. 12 of the 13 did no better than a coin flip could do by luck; on EUR/USD and the Dow the signals did worse than random.
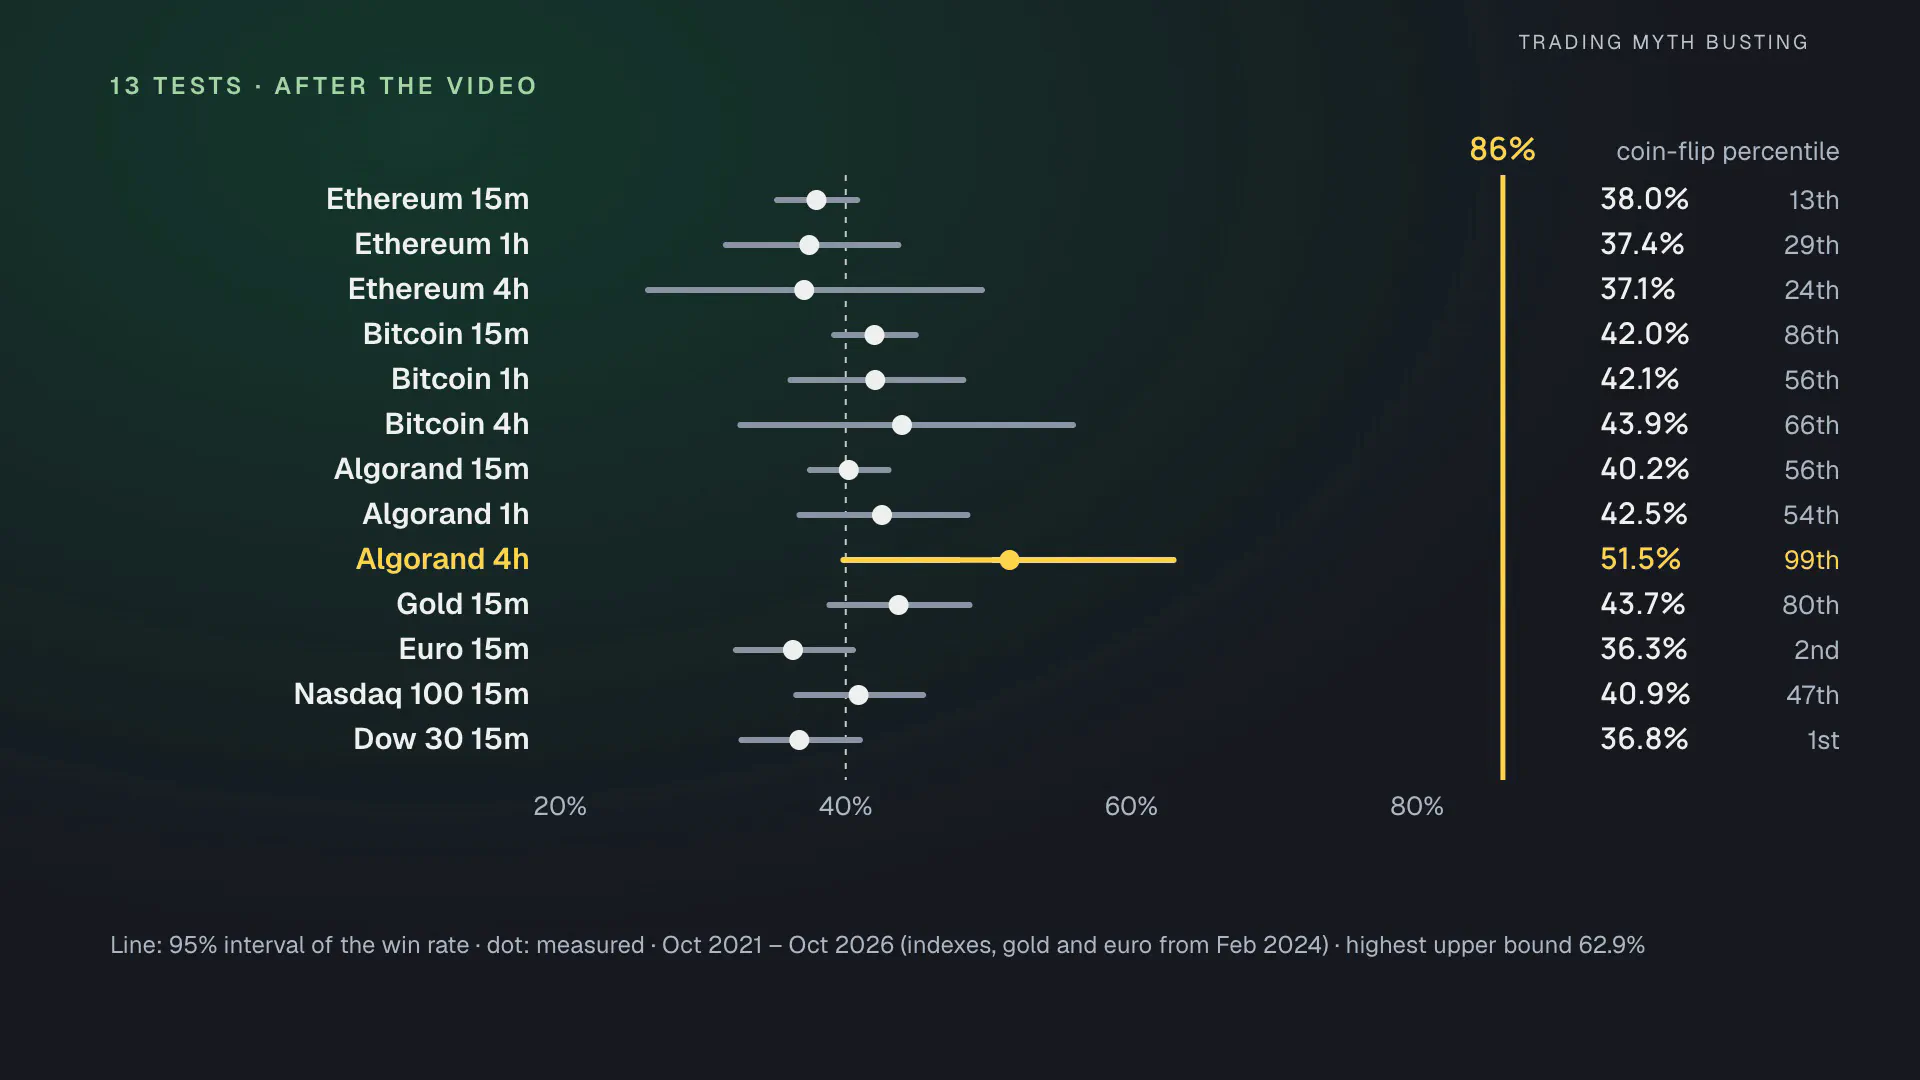
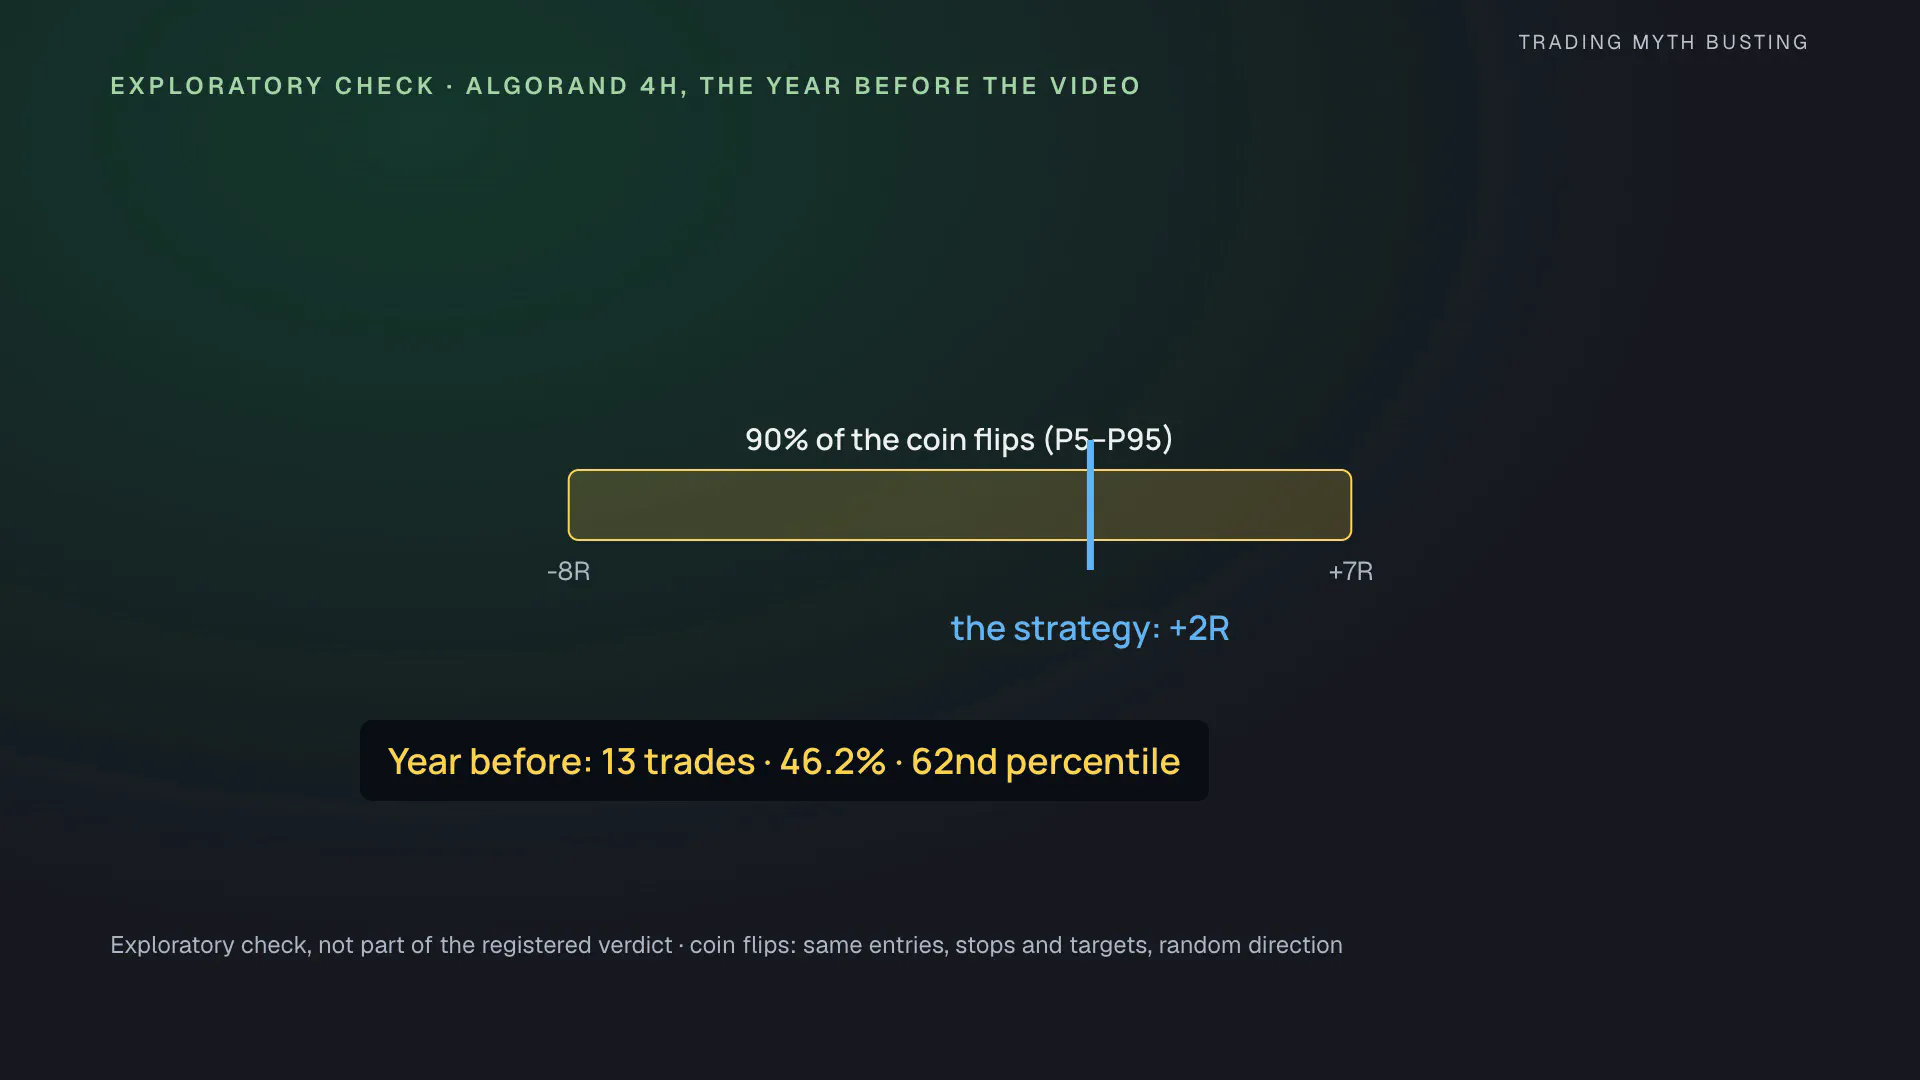
And then a winner: Algorand on 4-hour candles, 51.5% of 68 trades, better than 99% of the coin flips. When you try 13 things, the best one always looks better than it is, so we checked the same setting in the year before the video. It made 13 trades, won 46.2%, and landed at the 62nd percentile of the coin flips, right in the middle. That check is exploratory; it is not part of the registered verdict.
On “higher is more reliable”: on 4-hour candles bitcoin and Algorand were positive before costs and Ethereum was negative, with 62 to 68 trades each. That is not enough to decide. One effect is certain: on higher timeframes the stop is further away (a median of 3.5–4% on 4-hour candles), so costs matter less.
Why your chart may look better
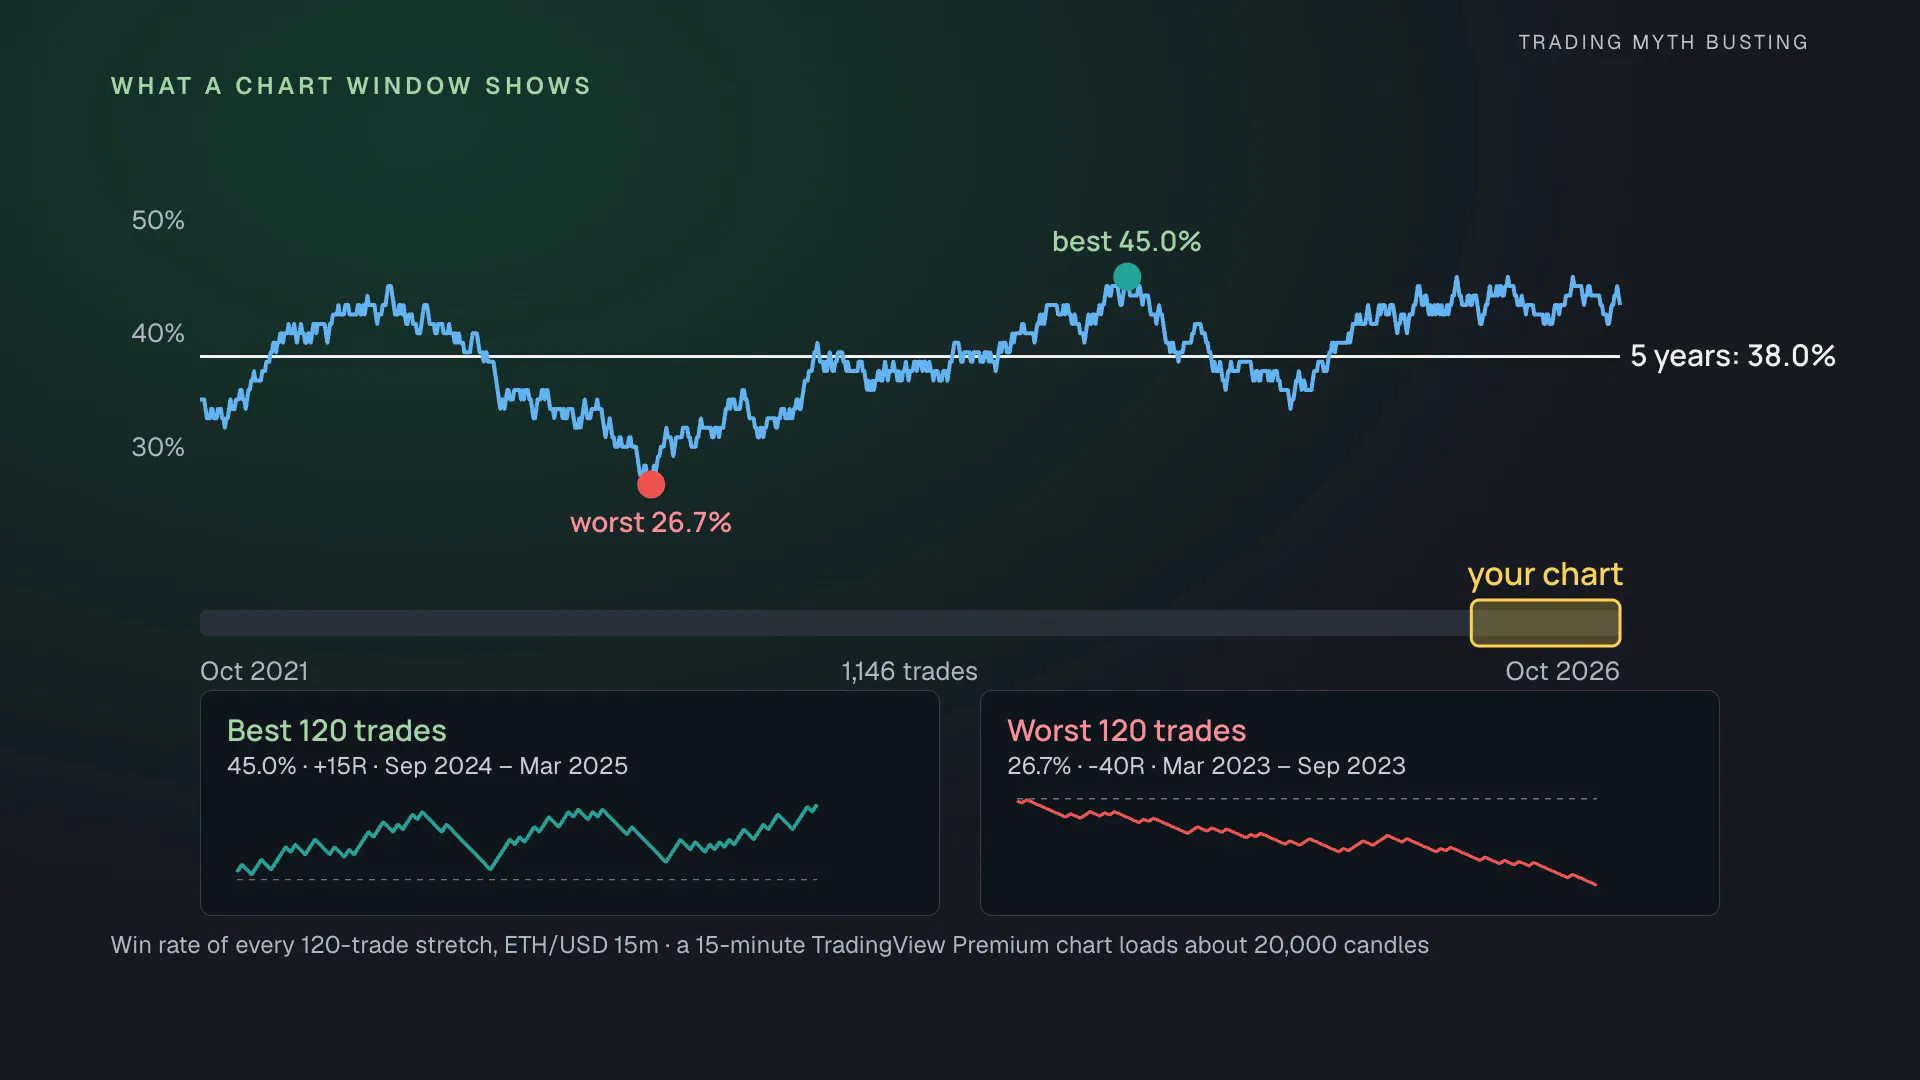
If you tried this on your own chart, it may have looked fine. That is not your chart’s fault. A 15-minute chart on TradingView Premium loads about 20,000 candles, about 7 months. On the last 7 months of our Ethereum data (April 6 to November 1, 2026), the strategy won 41.0% of 122 trades and finished at +3R.
Now slide a window of 120 trades across the 5 years. The best one won 45.0% and made +15R (September 2024 to March 2025). The worst won 26.7% and lost 40R (March 2023 to September 2023). Same rules, same market. With about 120 trades, the measured win rate can be 9 points off either way, so 7 months is not enough to tell a 38% strategy from a 45% one.
3 questions before you trust a win rate
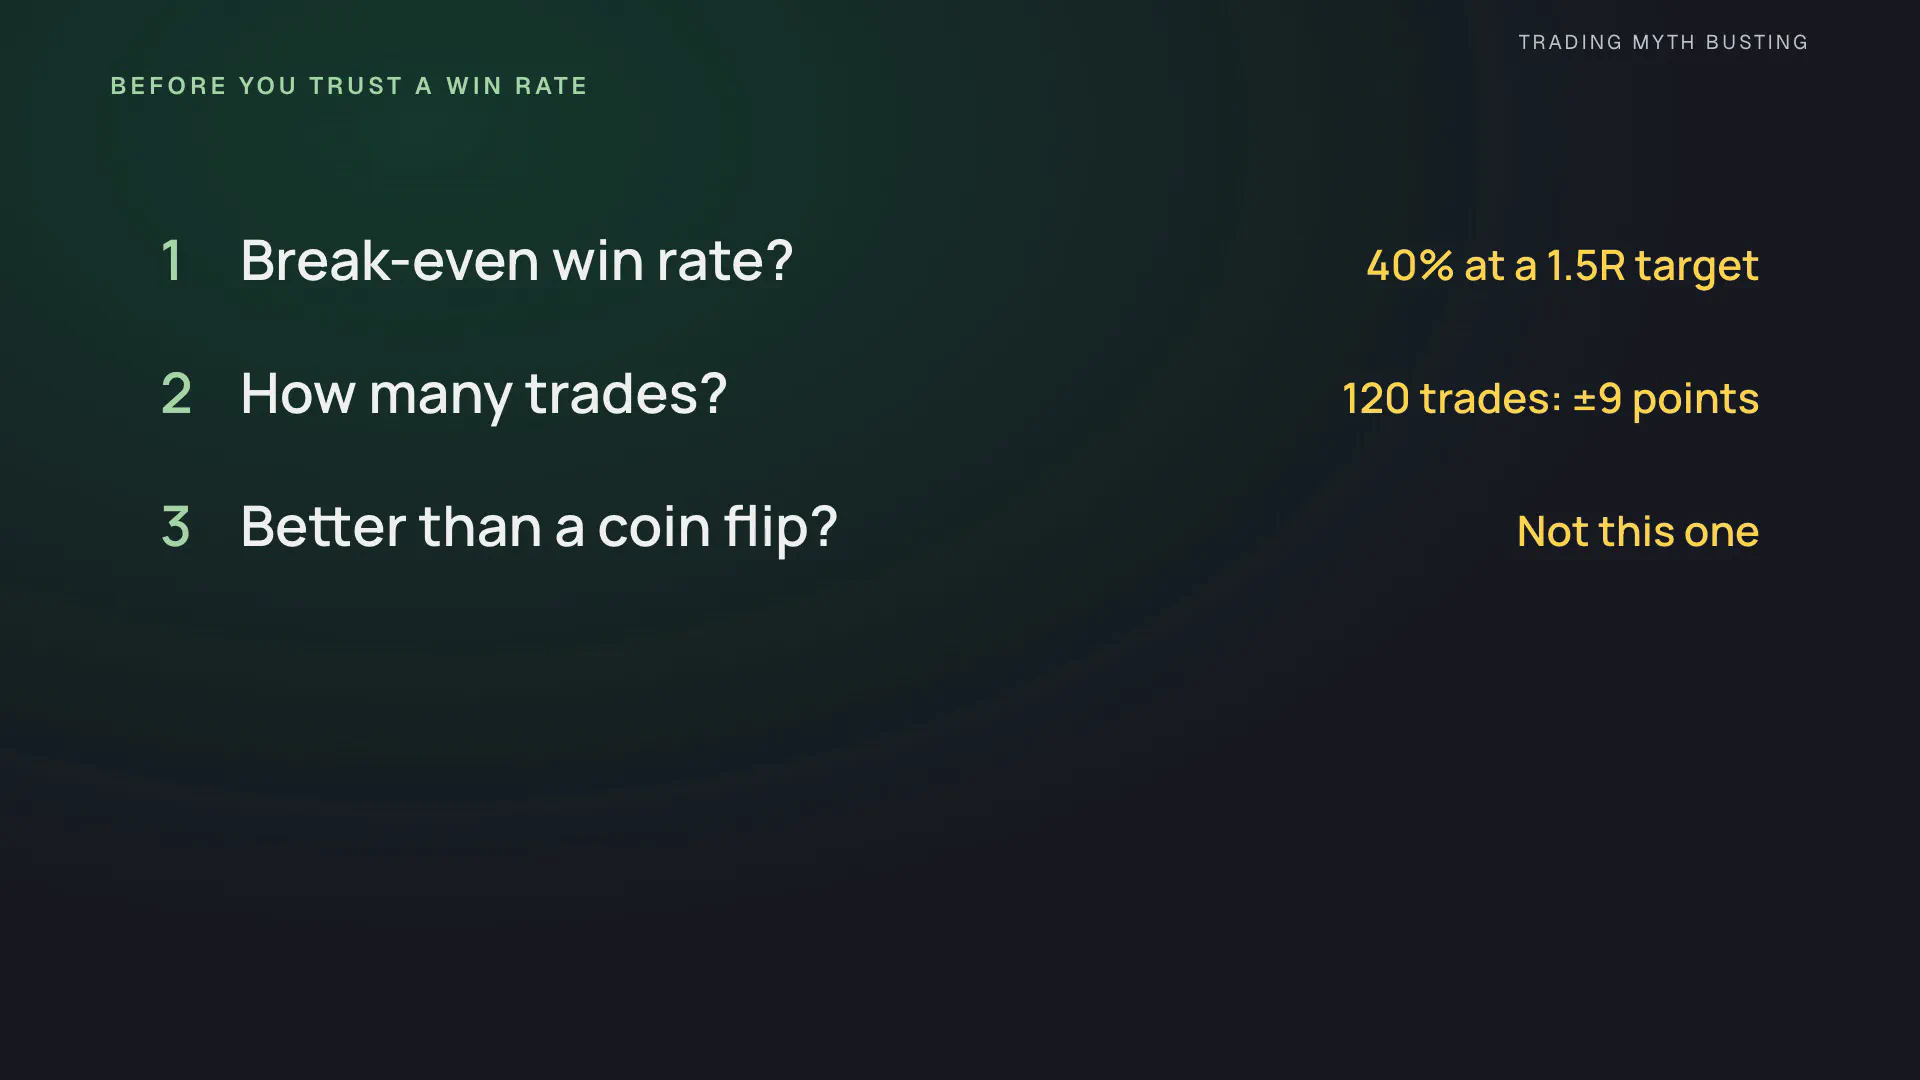
- What win rate does the target need to break even? At 1.5 times the risk, 40%. At 2 times the risk, 33%: 1 win pays for 2 losses.
- How many trades is it based on? With 120 trades, the measured win rate can be about 9 points off, either way.
- Does it beat a coin flip with the same stop and the same target? This one didn’t.
Reproduce it
- The script: MACD + 200 EMA + Support/Resistance, Pine source, MPL-2.0. The defaults are the rules as taught; the two-filter version without the support test, a fixed test window, the level settings, a stop buffer beyond the EMA and the trade direction are optional research inputs. It needs the public AutoSRZones library.
- Every run: all-results.csv lists all 13 tests in the default and the two-filter version, plus 7 more settings on Ethereum 15m (level prominence, tolerance, test window, stop buffer), before and after the video, with trade counts, win rates and their 95% intervals, R before costs and at 0.1% per round trip, the median risk, and the coin-flip percentile of the default rules.
- The IDE in the video: PyneIDE, our IDE for Pine Script inside Visual Studio Code. It runs scripts locally on PyneCore, the open-source Pine runtime, and its Robustness tab runs the coin-flip and account tests shown above.
Data and assumptions. The video shows Kraken charts, but Kraken’s API only serves recent candles, so the crypto tests use the same dollar pairs from Coinbase: 15-minute and 1-hour candles, with 4-hour candles built from the 1-hour ones. The main period is October 4, 2021 to October 31, 2026, after the video; the year before it is October 1, 2020 to October 3, 2021. Gold, EUR/USD, the Nasdaq 100 and the Dow are Capital.com CFD bid prices, with trades counted from February 1, 2024 to October 23, 2026. R is the result divided by the distance from the actual entry to the stop fixed on the signal candle; the totals are rule tests per market, not a portfolio return. When a 15-minute candle touches both the stop and the target, the main results follow TradingView’s assumption about the order inside the candle; counting the stop first lowers the Ethereum win rate to 35.3% and does not change any verdict. The 0.1% round-trip cost is a scenario deducted from the fills, not a measured broker cost; spreads and funding are not modeled. The $1,000 accounts are simulated from the backtest trades and are an illustration, not a registered test. The “key level” definition, the test window and the reading of “200 day” are our definitions of the video’s discretionary method, not the creator’s exact process. The research ran the script before two fill-timing corrections (the target is now placed from the real entry as soon as it fills, and no entry is taken on the candle a trade closed on); on the full Ethereum data that removes 8 of 1,447 trades and changes no verdict, and the PyneIDE numbers above come from the corrected script. The published TradingView script has the “On order fill” setting off by default, because TradingView puts a warning on every strategy that uses it; switched on, the script repeats the corrected one trade for trade. With the default, the target on the entry candle is estimated from the signal candle’s close. On the full Ethereum data that changes the exit of 96 of 1,439 trades and moves the win rate by less than 0.1 percentage point.
If you get a different result, include the symbol, dates, settings and costs so we can compare the experiments.