
Myth Busting · Episode 03
Can an EMA Strategy Really "Never Lose"?
TL;DR: A lesson promises three EMA strategies that never lose. Turned into code and tested on 4-hour charts of EUR/CAD, EUR/USD, gold and bitcoin, only one of the three tactics is a complete strategy. It placed 5 trades in 2 years and 9 months, and 4 of them lost. Its “80% accuracy” tactic never came close to 80% on any market. Script, data notes and every run are below.
The claim
The lesson is Trader DNA’s 3 EMA Strategies That NEVER LOSE — EVER!, published November 6, 2025. It names three mistakes first: price above the average means an uptrend, a touch of the average is an entry, a crossover is an entry. Then it offers three tactics that fix them.
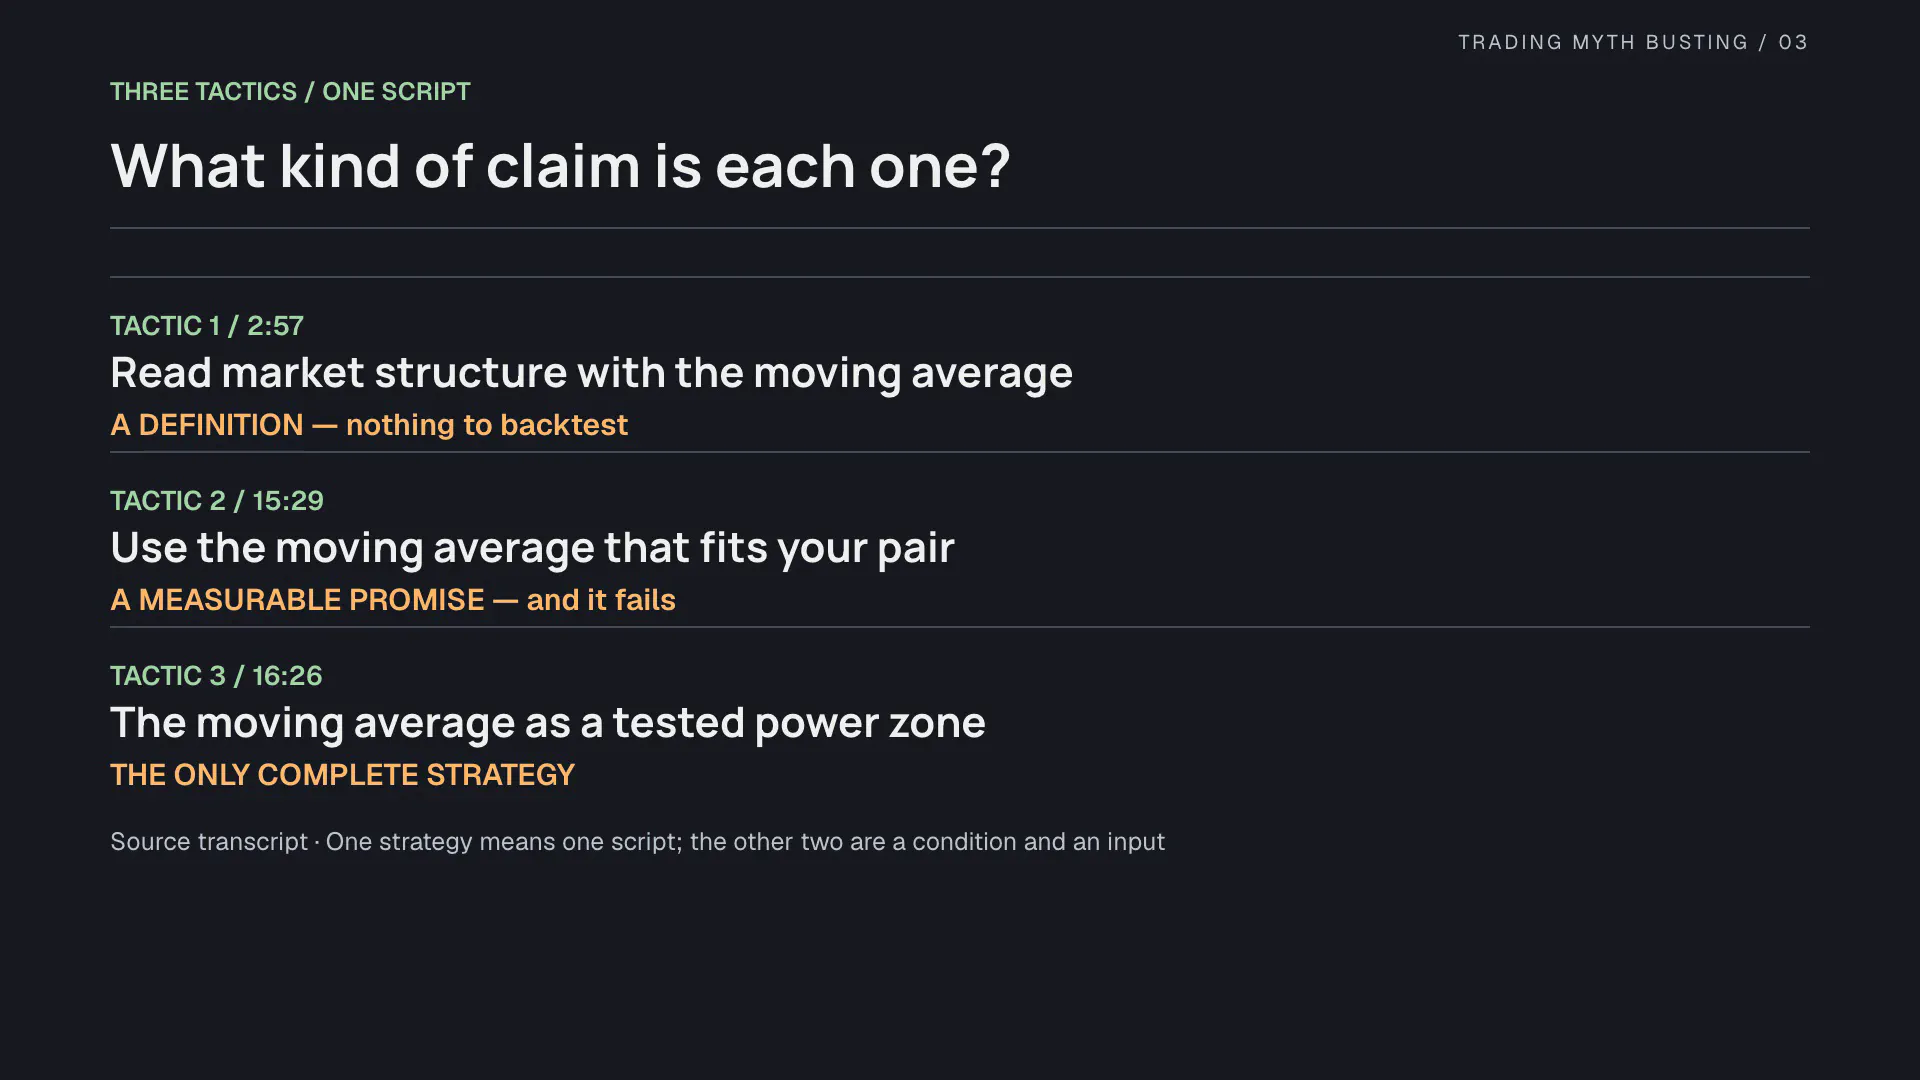
We test trading claims the same way every time: write the rules as code, run them on fixed data, keep every result. The first thing the code showed is that the three tactics are three different kinds of claim, and only one of them can be backtested as a strategy.
Tactic one is a definition
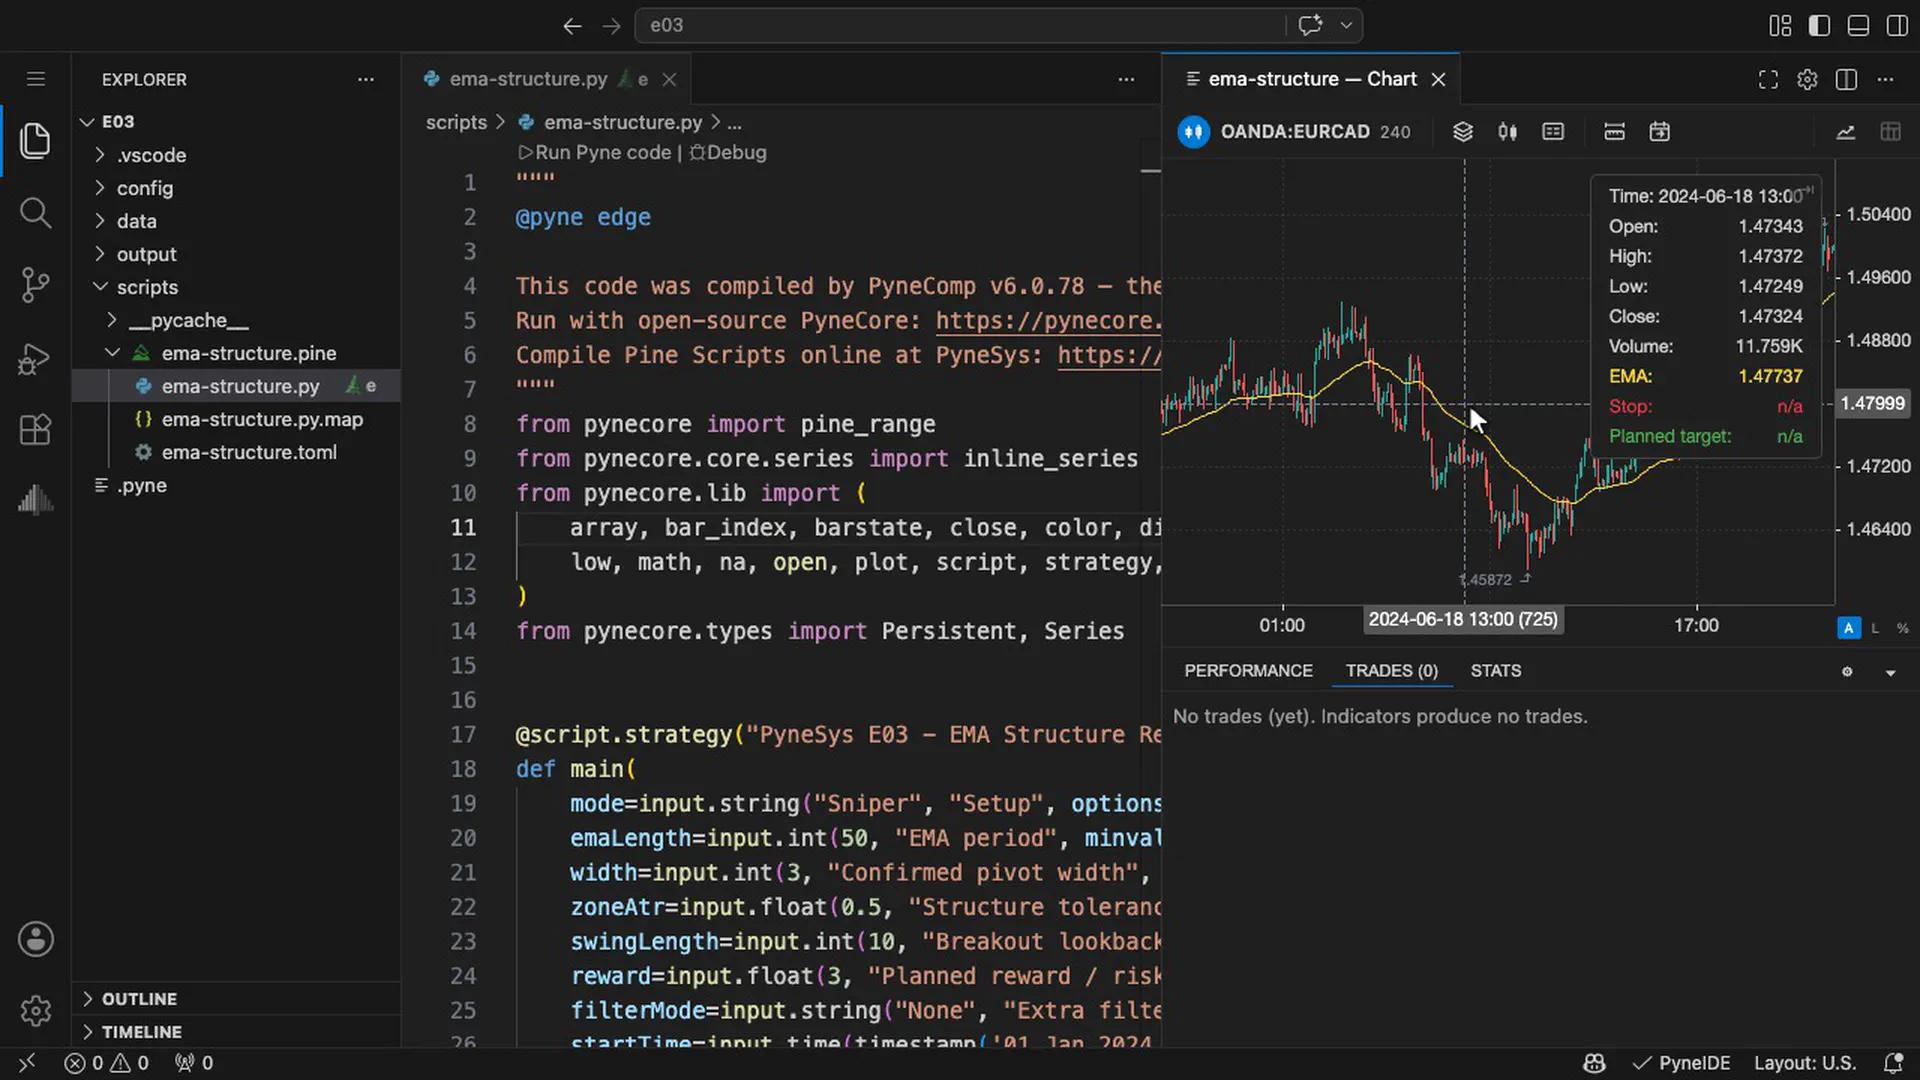
Read market structure together with the moving average: in an uptrend, price makes higher highs and higher lows, and the average only means something once the structure agrees. That is reasonable advice. In code it is two lines:
bool bullStructure = not na(prevH) and not na(prevL) and lastH > prevH and lastL > prevL
bool bearStructure = not na(prevH) and not na(prevL) and lastH < prevH and lastL < prevL
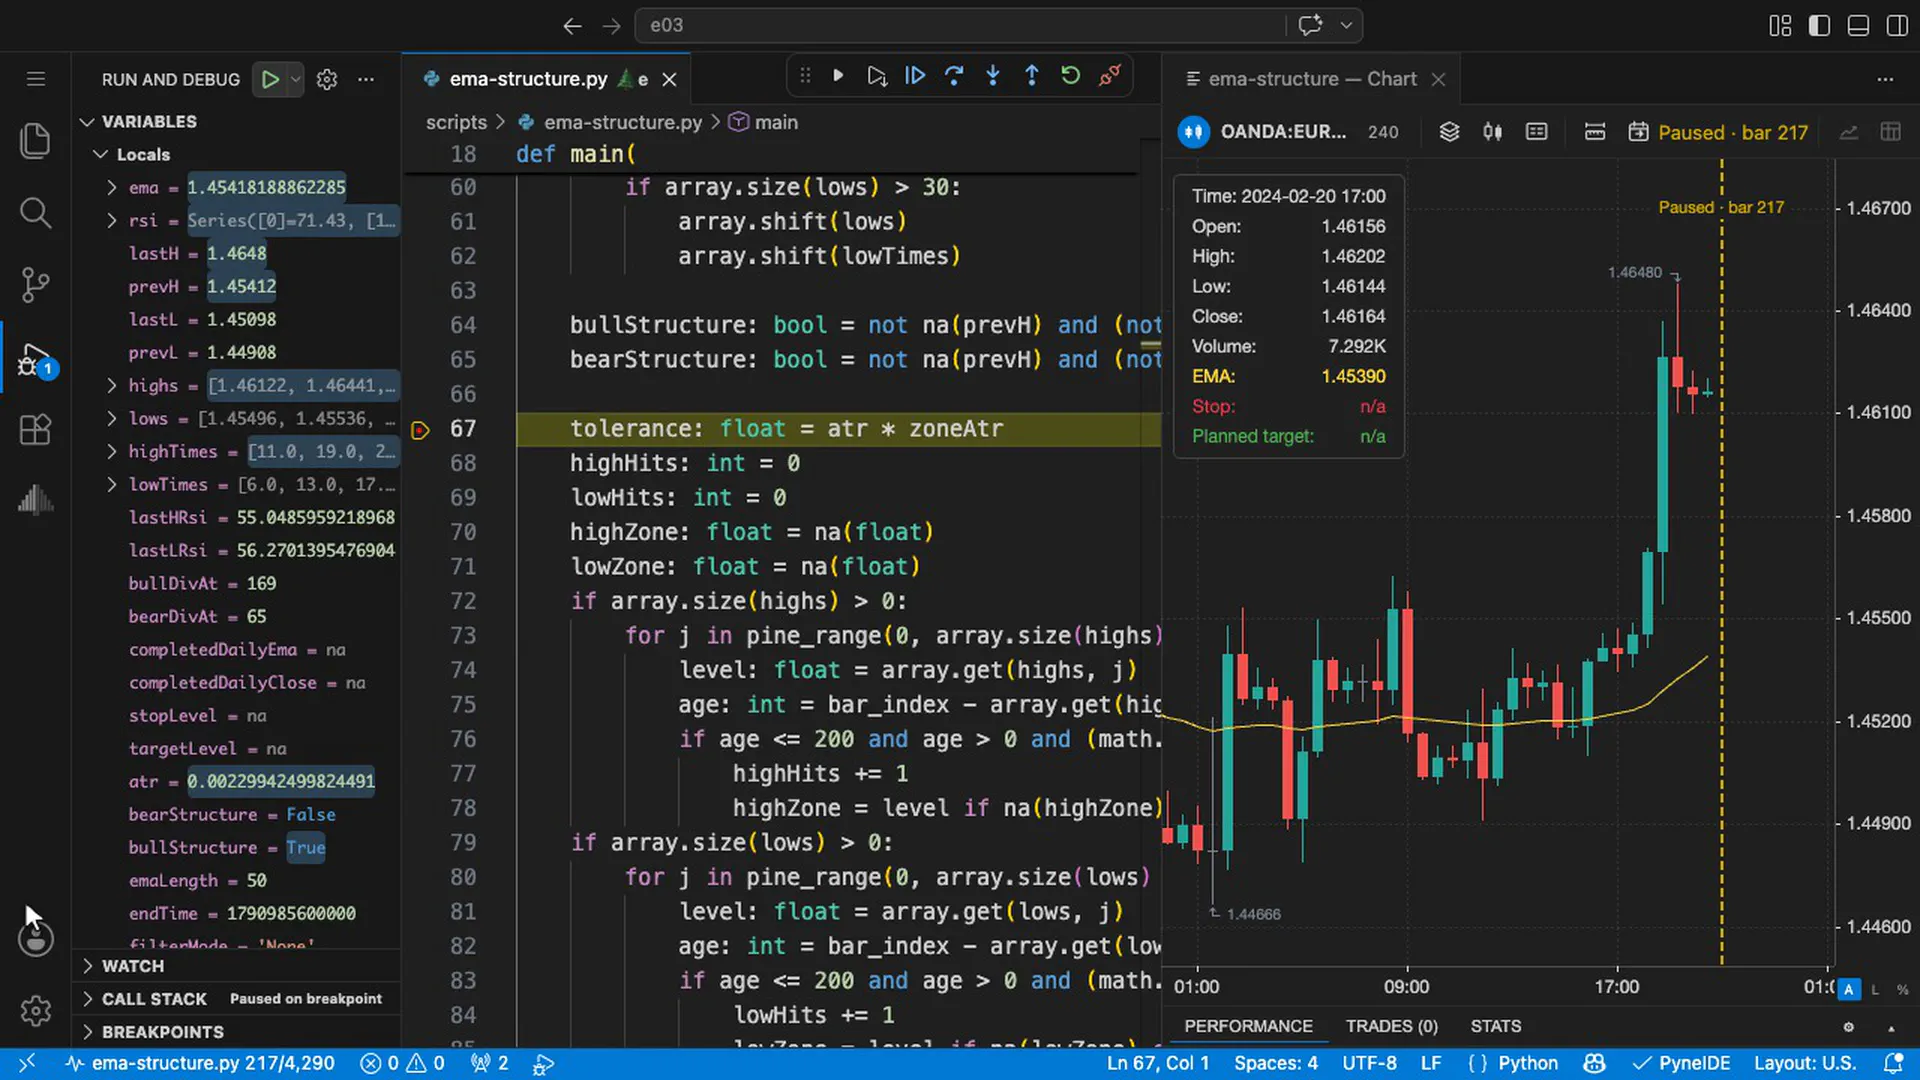
There is no entry, no stop and no target. The debugger shows exactly that: on bar 217 of the EUR/CAD run, bullStructure turns true, and the stop and target levels stay empty. Nothing is traded, so there is nothing to backtest. Tactic one cannot be right or wrong about money.
Tactic two: the 80% promise
Use the moving average that fits your specific pair, and the lesson says your accuracy can reach 80%. Accuracy is a hit rate, so it can be measured directly.
We built the lesson’s own selection procedure and kept it honest in time:
- Seven candidate periods: 20, 30, 50, 75, 100, 150 and 200.
- Only the earlier history chooses: prices before November 6, 2025, the day the original video was published.
- The winner is the best mean R after a fixed 5 basis-point round-trip cost, with at least 20 earlier trades.
- The choice is then locked. The later period, November 6, 2025 to October 2, 2026, is never allowed to pick a replacement.
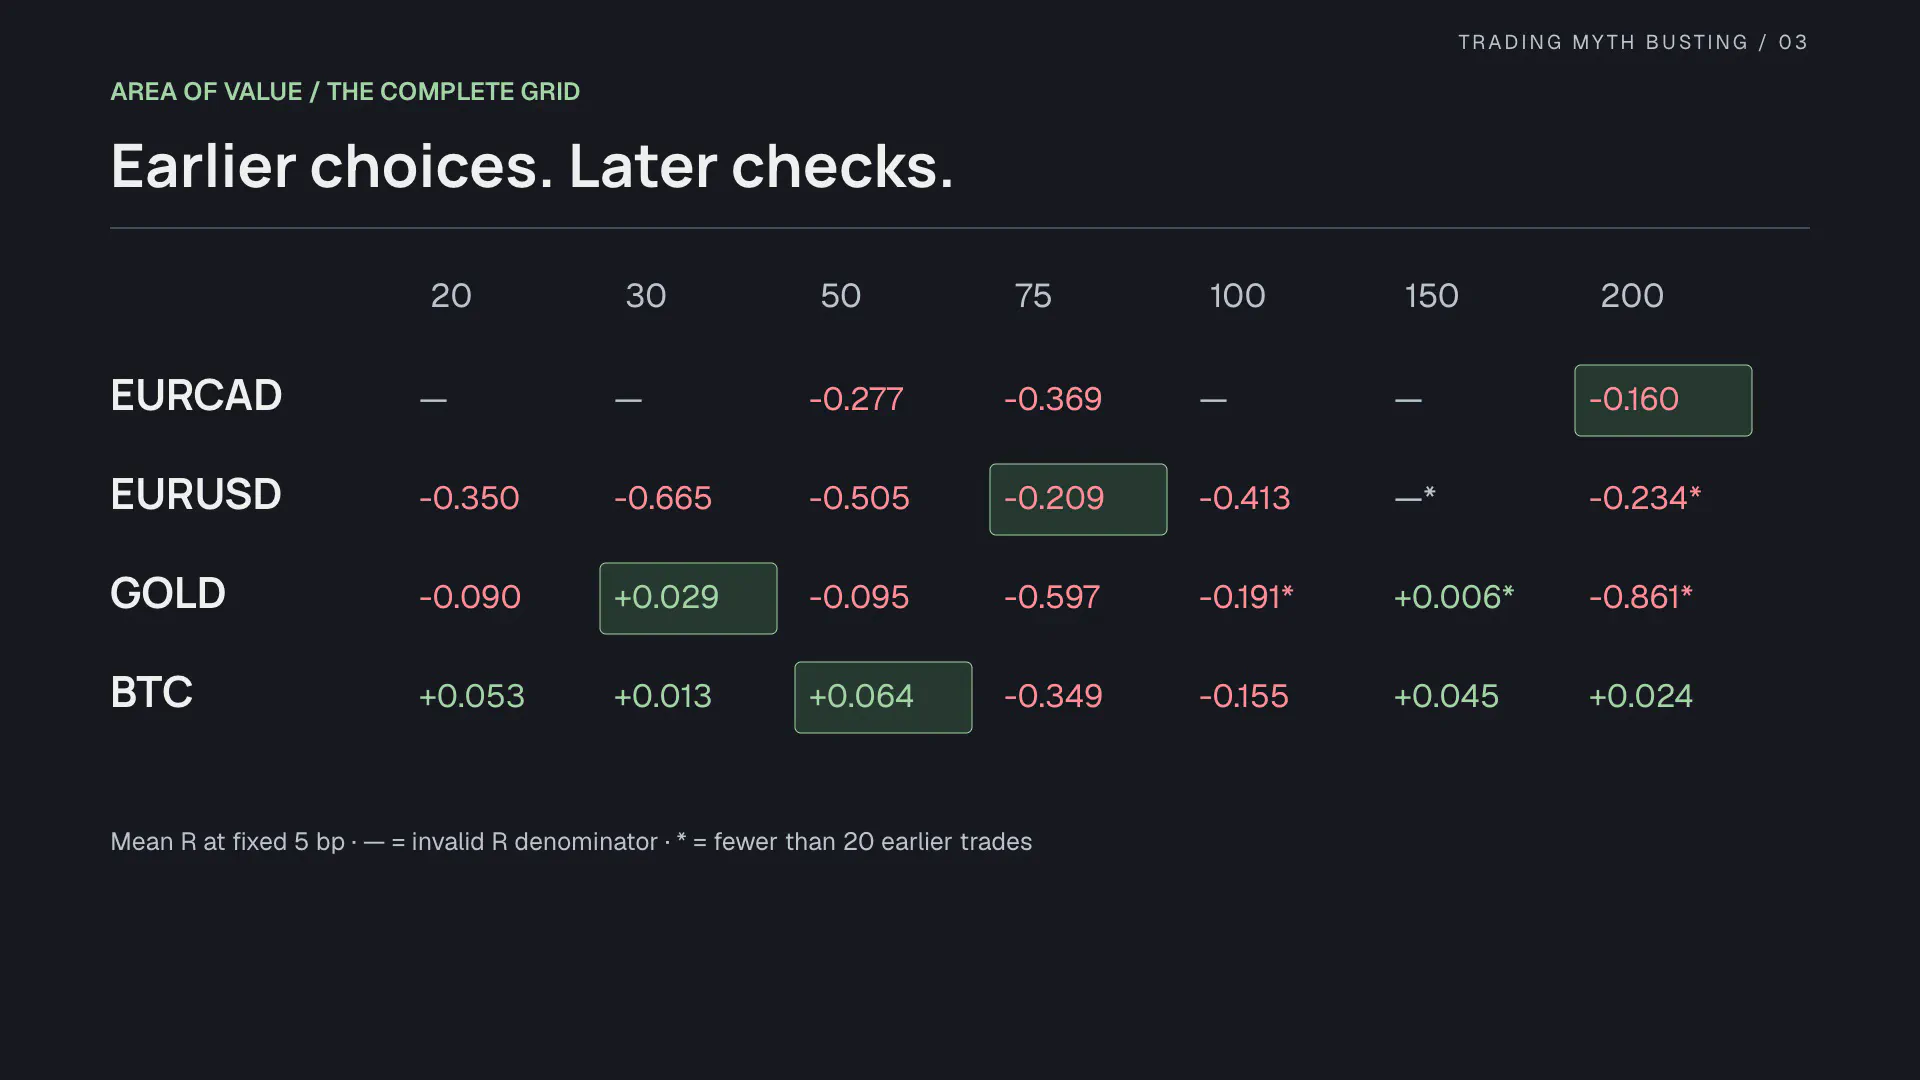
The procedure chose 200 on EUR/CAD, 75 on EUR/USD, 30 on gold and 50 on bitcoin. Here is what those choices delivered:
| Market | EMA | Earlier hit rate | Earlier trades | Later hit rate | Later trades |
|---|---|---|---|---|---|
| EUR/CAD | 200 | 29.0% | 31 | 21.7% | 23 |
| EUR/USD | 75 | 25.0% | 28 | 35.7% | 14 |
| Gold | 30 | 30.6% | 36 | 35.3% | 17 |
| Bitcoin | 50 | 27.7% | 65 | 28.0% | 25 |
Across both windows that is 239 trades and 68 winners, 28.5%. No market came close to 80% in either window.
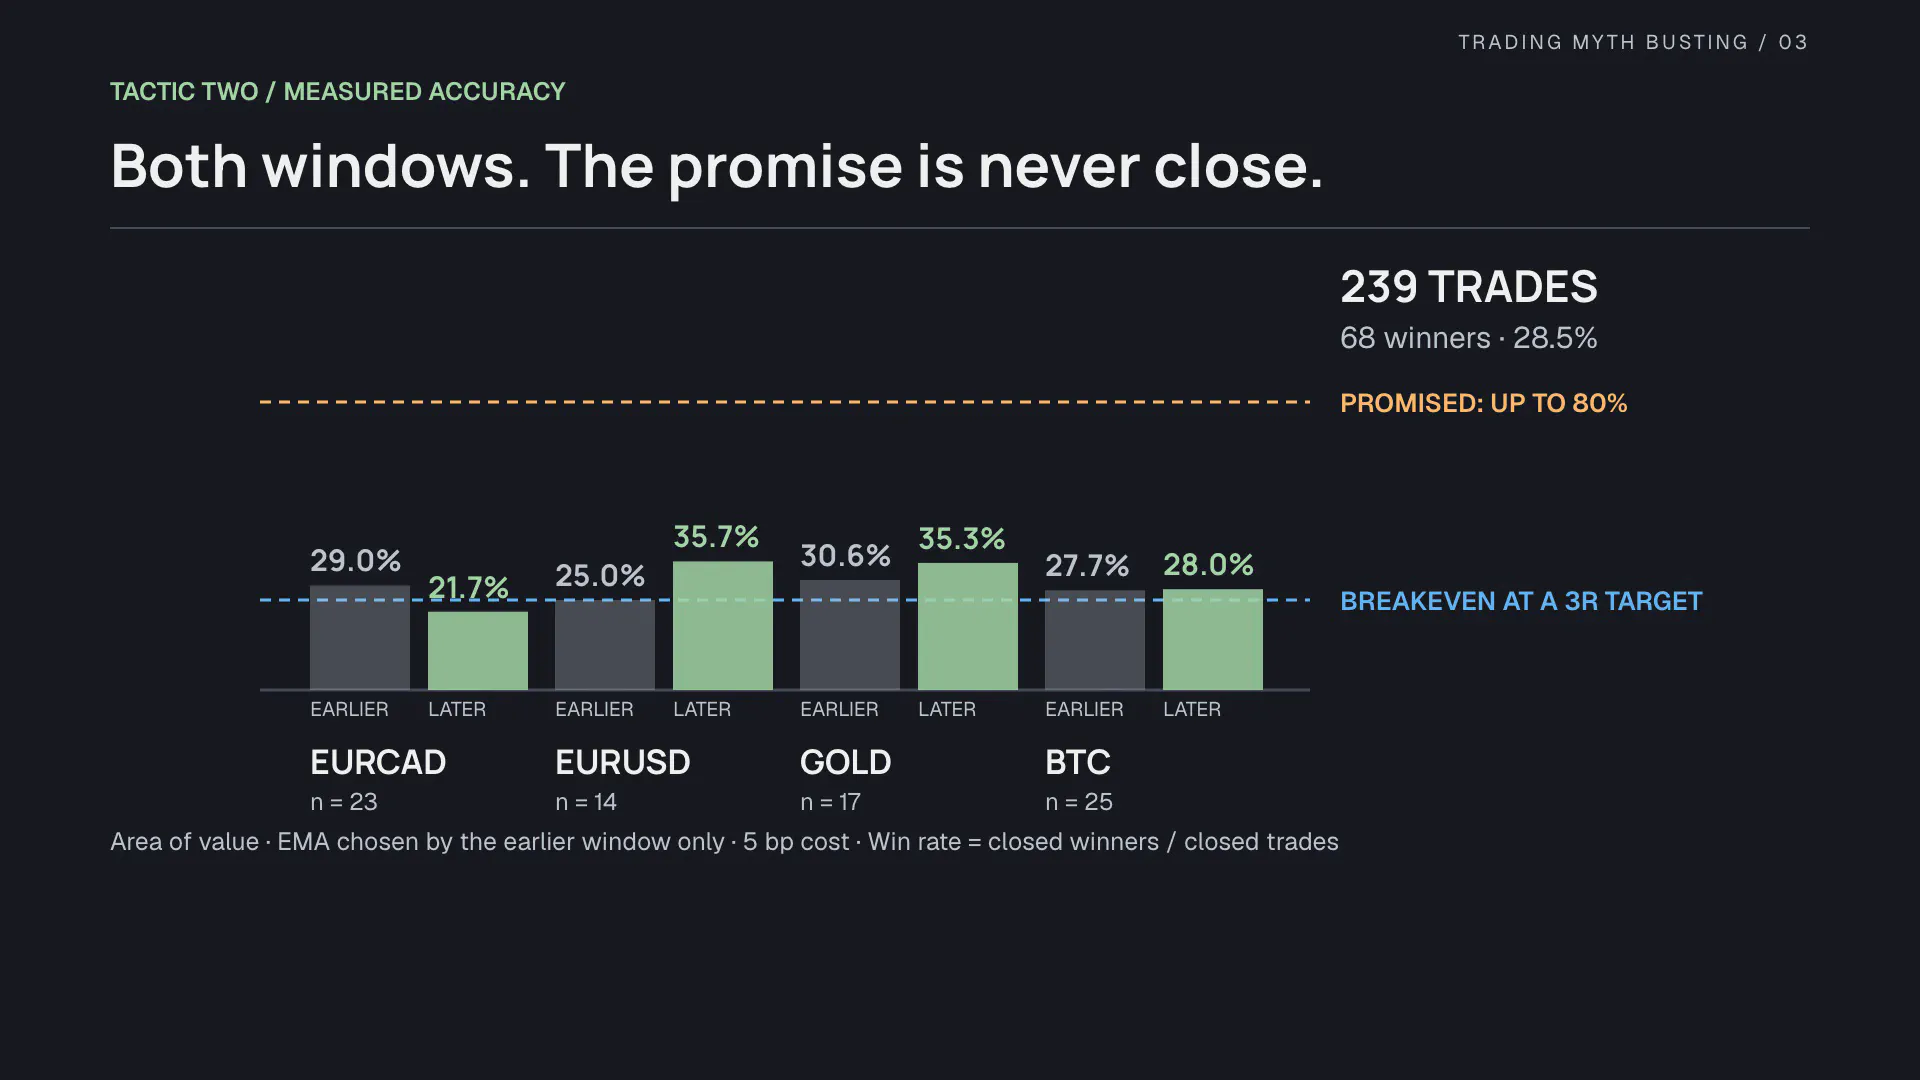
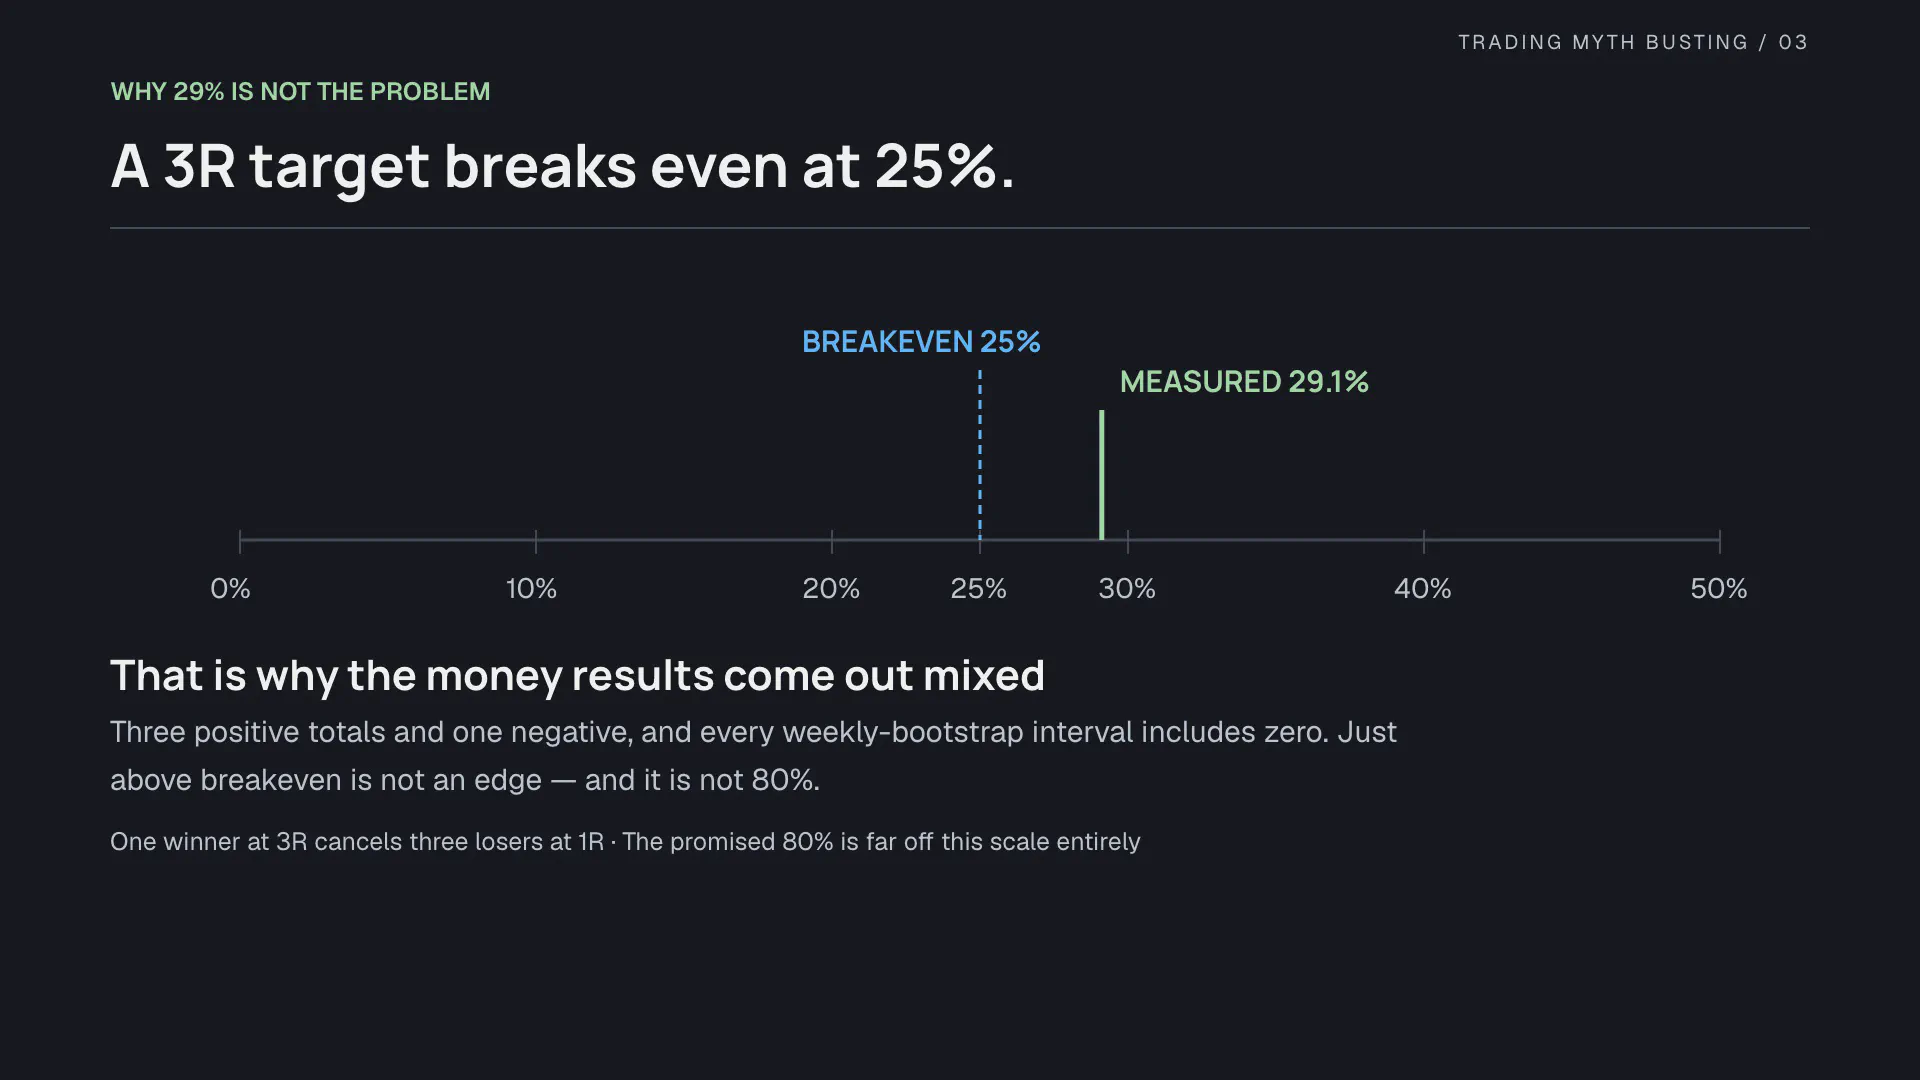
A 29% hit rate is not automatically bad. The target is 3 times the risk, so breakeven sits at 25%, and the later period’s 29.1% is just above it. That is why the money results come out mixed rather than clearly good or clearly bad, and why every weekly bootstrap interval we measured for mean R includes zero.
Did fitting the average to the pair help? Compare each chosen period with simply keeping EMA 50 in the same later window:
| Market | Selected EMA | Keep EMA 50 (R) | Selected EMA (R) |
|---|---|---|---|
| EUR/CAD | 200 | −25.62 | −13.49 |
| EUR/USD | 75 | +2.89 | +1.80 |
| Gold | 30 | −0.39 | +4.40 |
| Bitcoin | 50 | +1.73 | +1.73 |
Two better, one worse, one unchanged. The promised number fails clearly; the mechanism behind it shows no detectable benefit either way.
Tactic three: the only complete strategy
The creator calls it his favorite strategy of all time: the moving average as a power zone. Price pulls back to it, the zone lines up with a level that has been tested several times, and a candle confirms the bounce. It has an entry, a stop and a target, so this is where the title has to stand or fall.
The lesson picks its zones by eye, so we had to choose mechanical thresholds:
- Swing points are confirmed 3 bars later, never backdated.
- A zone needs at least 2 earlier swing highs (or lows) within half an ATR(14) of the current EMA, from the last 200 bars.
- The previous close must already be beyond the zone, and the current bar must come back to retest it.
- A confirming candle: a full-bodied candle in the trade direction, a hammer or star, or an engulfing candle.
- Entry at the next bar’s open, stop one tick beyond the signal candle, target at 3 times the risk.
bool retestHighZone = low <= highZone + tolerance and high >= highZone - tolerance
bool bullZone = highHits >= 2 and close[1] > highZone + tolerance and retestHighZone
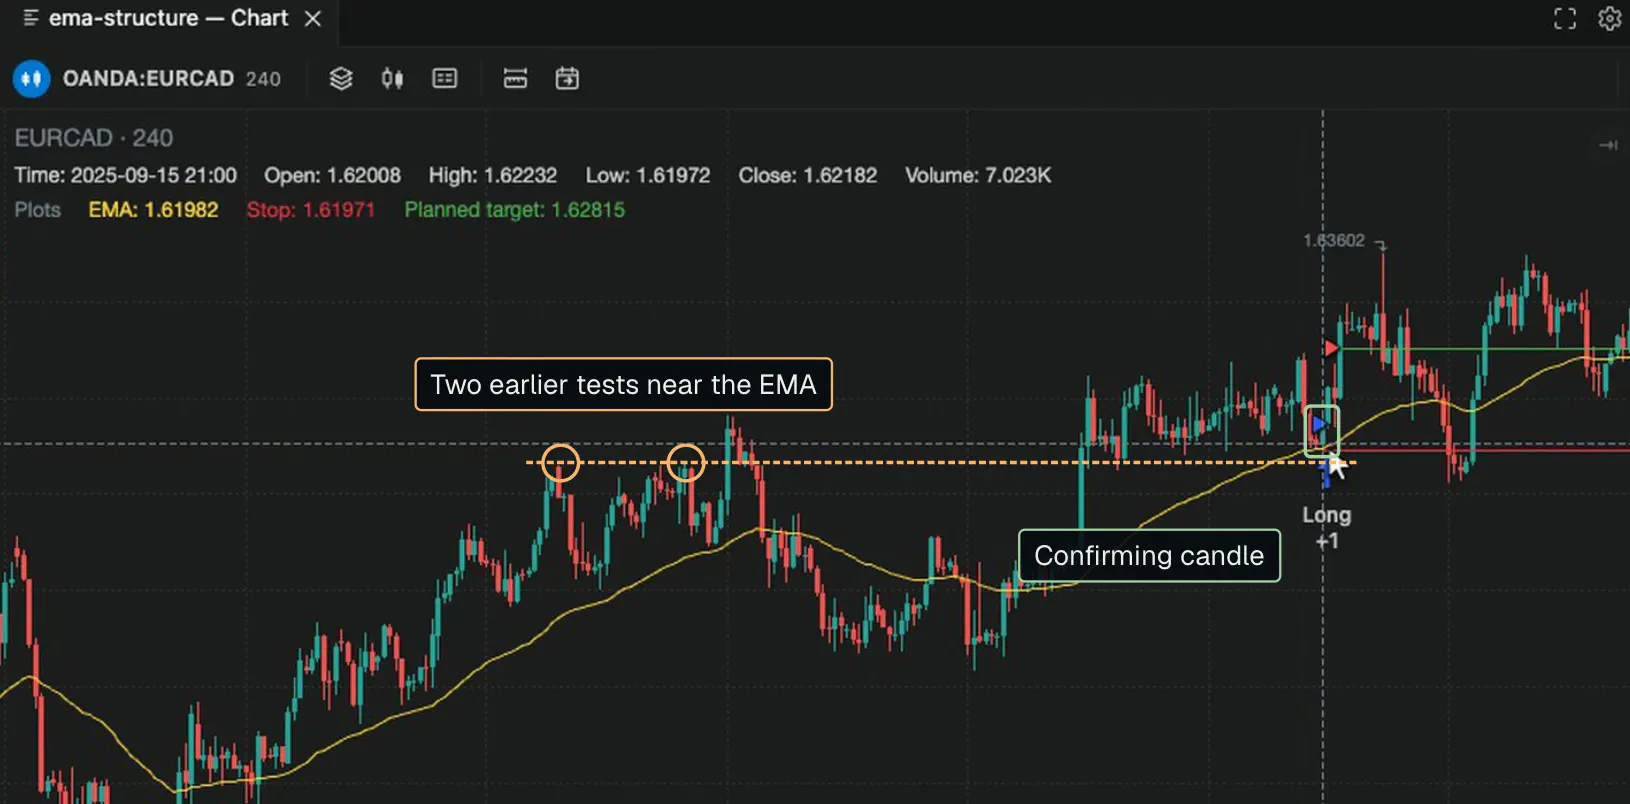
Here is the first Sniper trade, on EUR/CAD: two earlier tests near the EMA on August 17 and August 21, 2025, and the confirming candle on September 16.
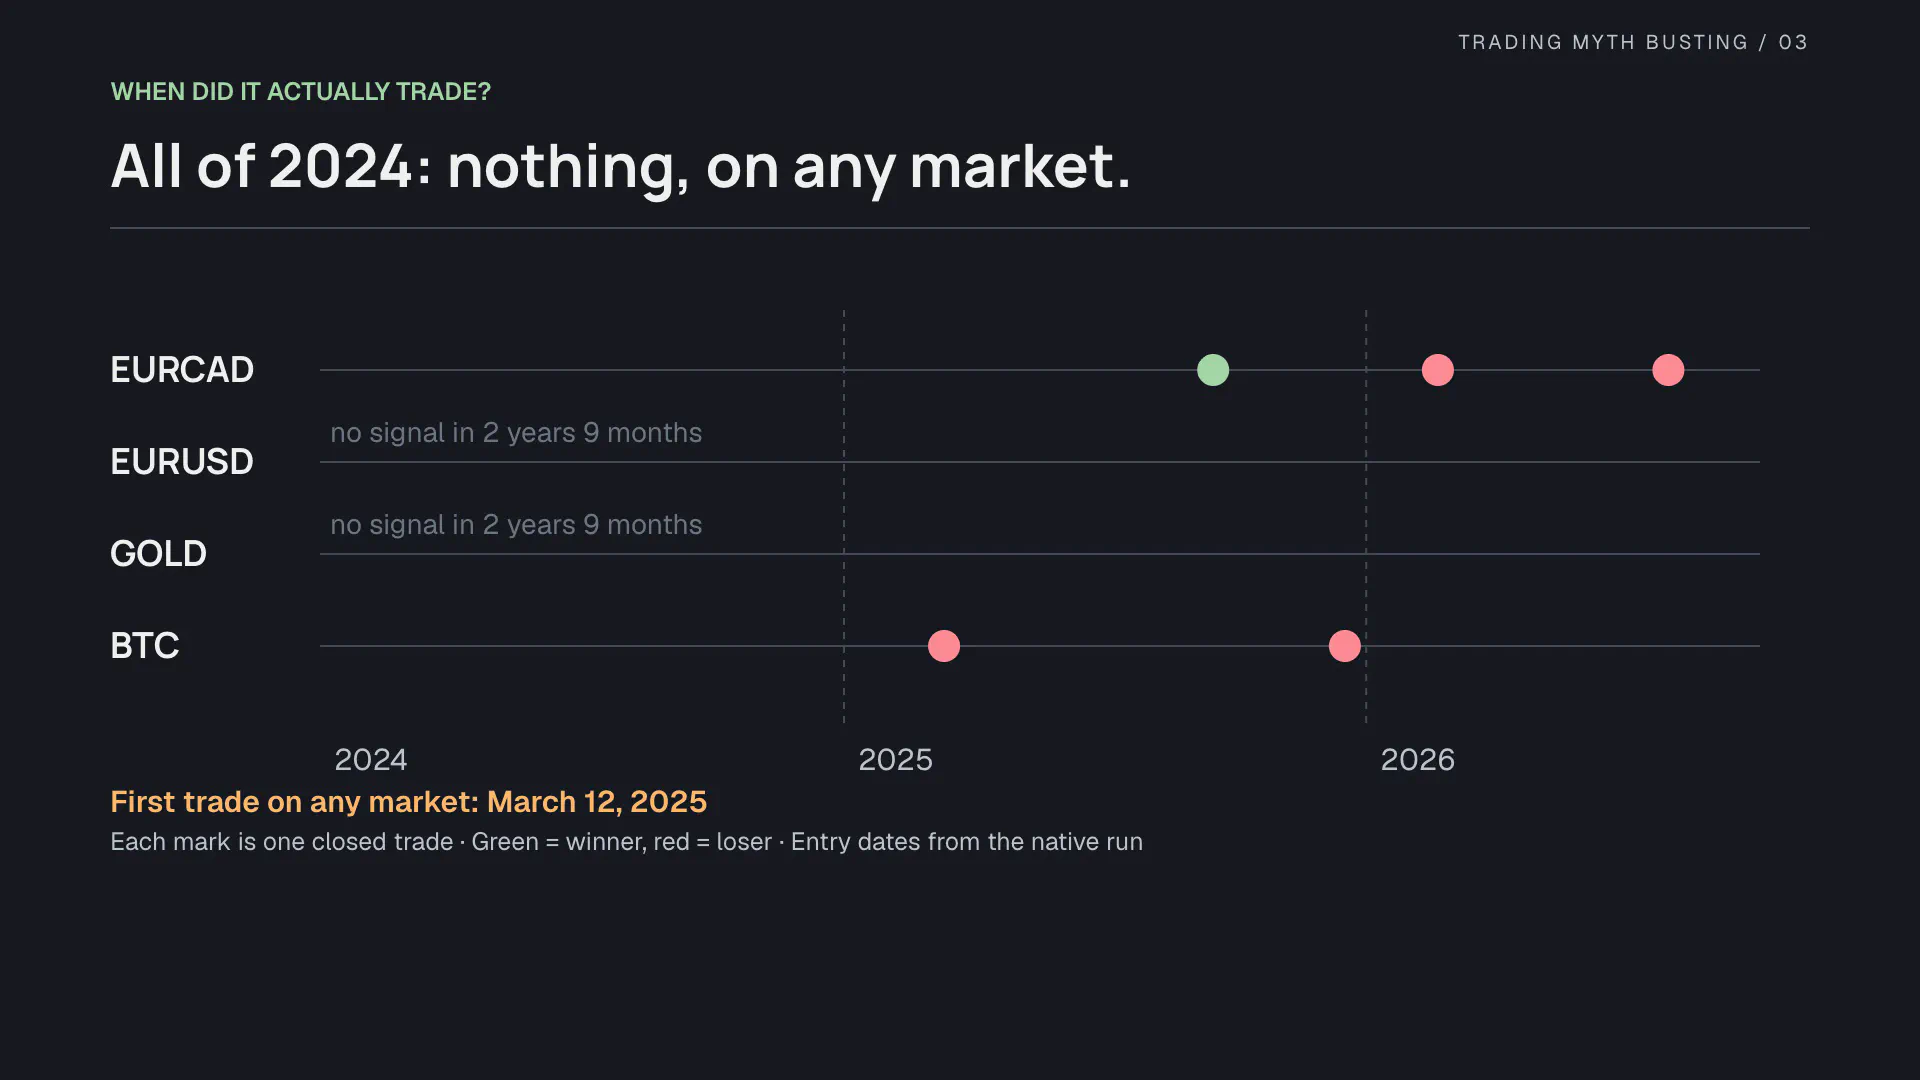
Over 2 years and 9 months on four markets it produced 5 trades: 3 on EUR/CAD, none on EUR/USD, none on gold, 2 on bitcoin. The first one did not arrive until March 2025. One made money, four lost.
What the test supports
“Never lose, ever” is an absolute claim. A single loss ends it, and there are four. But five trades cannot prove the opposite either: you cannot measure accuracy, an edge or a drawdown from five trades. The honest finding is that the setup, once defined precisely enough to run, is too rare to support any promise in either direction. The strongest claim in the title rests on the weakest evidence in the lesson.
Reproduce it
- The script: EMA Structure Research on TradingView. One script holds all three tactics: Sniper is the default setup, Area value drops the zone requirement, and the optional comment-suggested variants are inputs. Pine source, MPL-2.0.
- Every run: all-results.csv lists all 264 runs with their trade counts, gross and cost-adjusted R, hit rates and drawdowns, per period.
- The IDE in the video: PyneIDE, our IDE for Pine Script inside Visual Studio Code. It runs scripts locally on PyneCore, the open-source Pine runtime, and lets you step through them bar by bar in a debugger.
Data and assumptions. January 1, 2024 – October 2, 2026, standard 4-hour candles. EUR/CAD from OANDA; EUR/USD and gold from Capital.com bid quotes, aggregated from complete 5-minute buckets; bitcoin from Bybit USDT perpetual futures, aggregated the same way. R is measured from the actual entry to the initial stop. The 2, 5 and 10 basis-point round-trip costs are sensitivity scenarios deducted from gross fills, not measured broker costs; funding, financing and spreads are not modeled. Results are separate rule tests per market with a fixed one-unit position, not a portfolio return. Pivot width, zone tolerance, candle thresholds and the signal-candle stop are our definitions, not the creator’s exact discretionary method.
If you get a different result, include the symbol, dates, settings and costs so we can compare the experiments.