
Myth Busting · Episode 02
Does One Candle Scalping Work on Stocks?
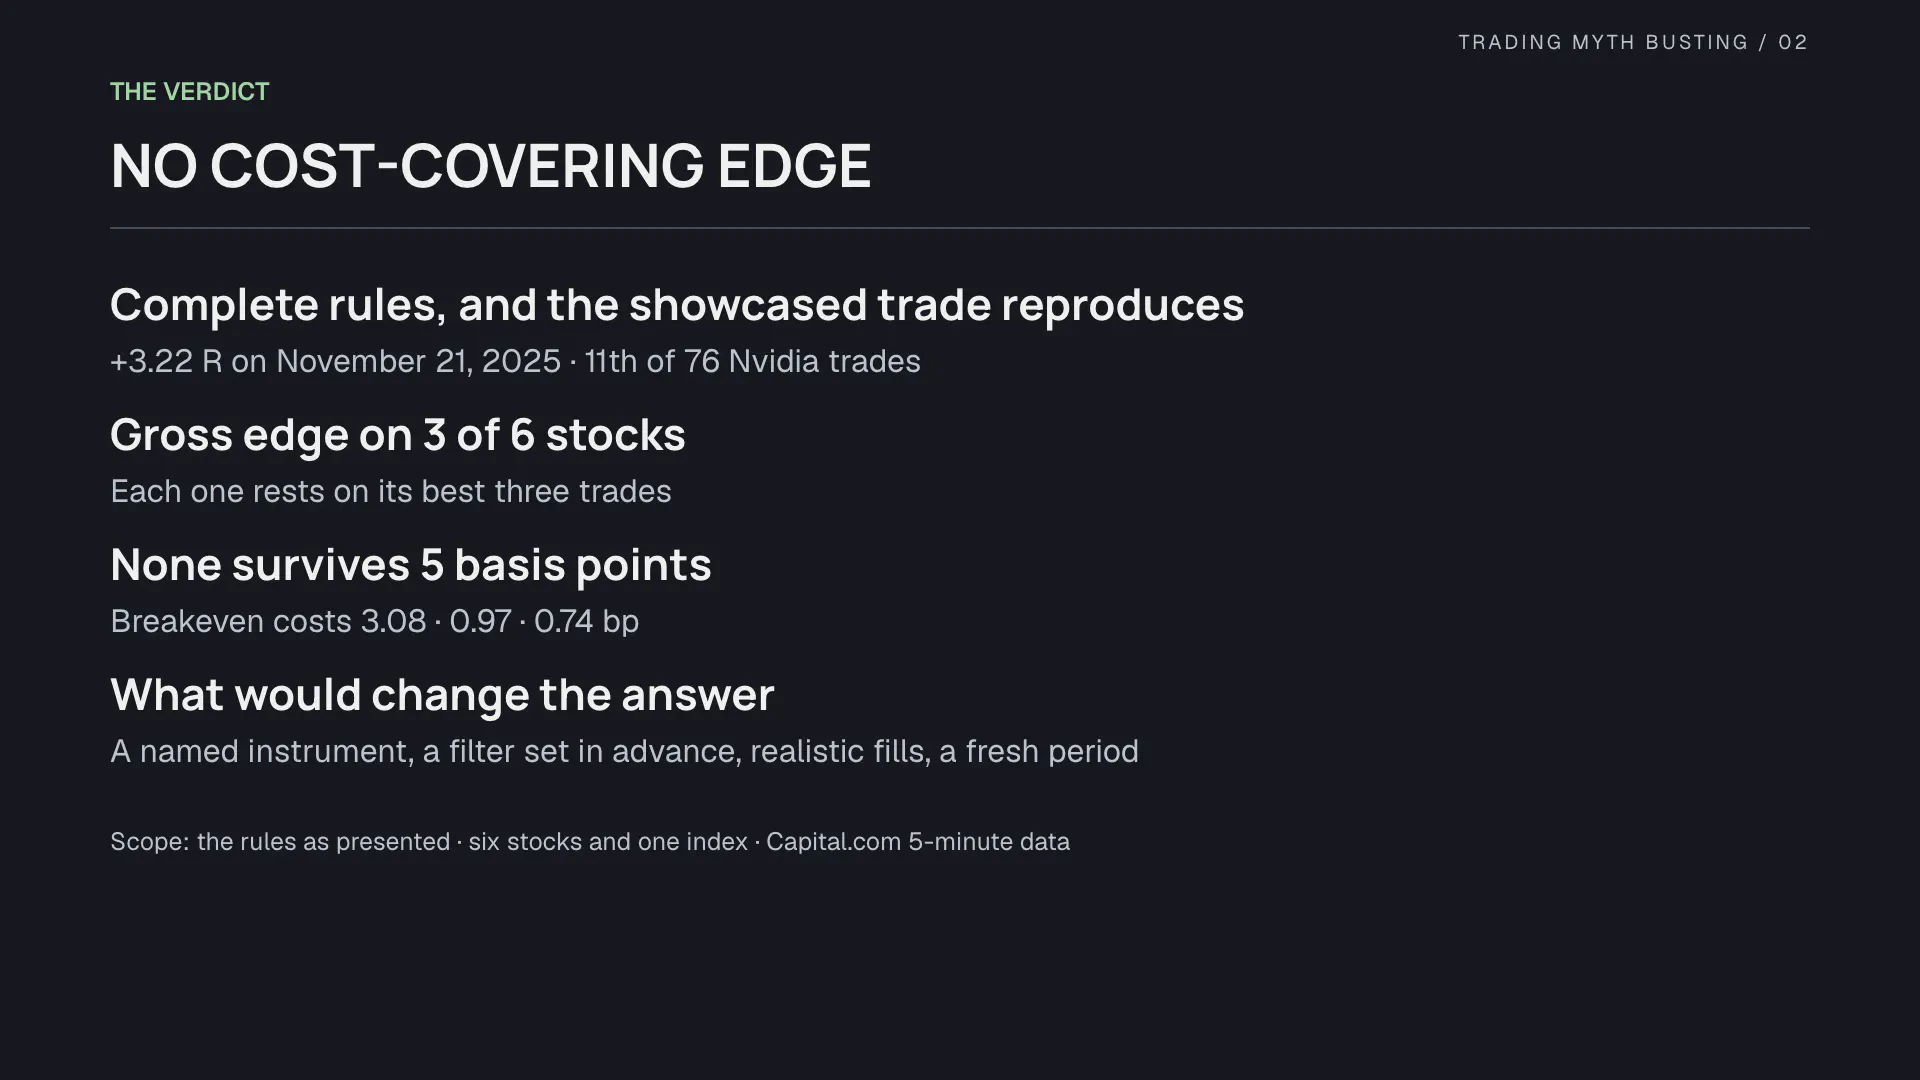
TL;DR: A popular video showcases one Nvidia trade from the Quick Flip Scalper: +3.22 times the risk in a single session. We turned the rules into code, and that trade reproduces exactly. Among the strategy’s 76 Nvidia trades it ranks 11th; the median trade is a full stop-out. Across six stocks, three made money before costs, each of those three rests on its three best trades, and none of the six stays positive after a 5-basis-point round-trip cost. Script, tables and data notes are below.
The claim
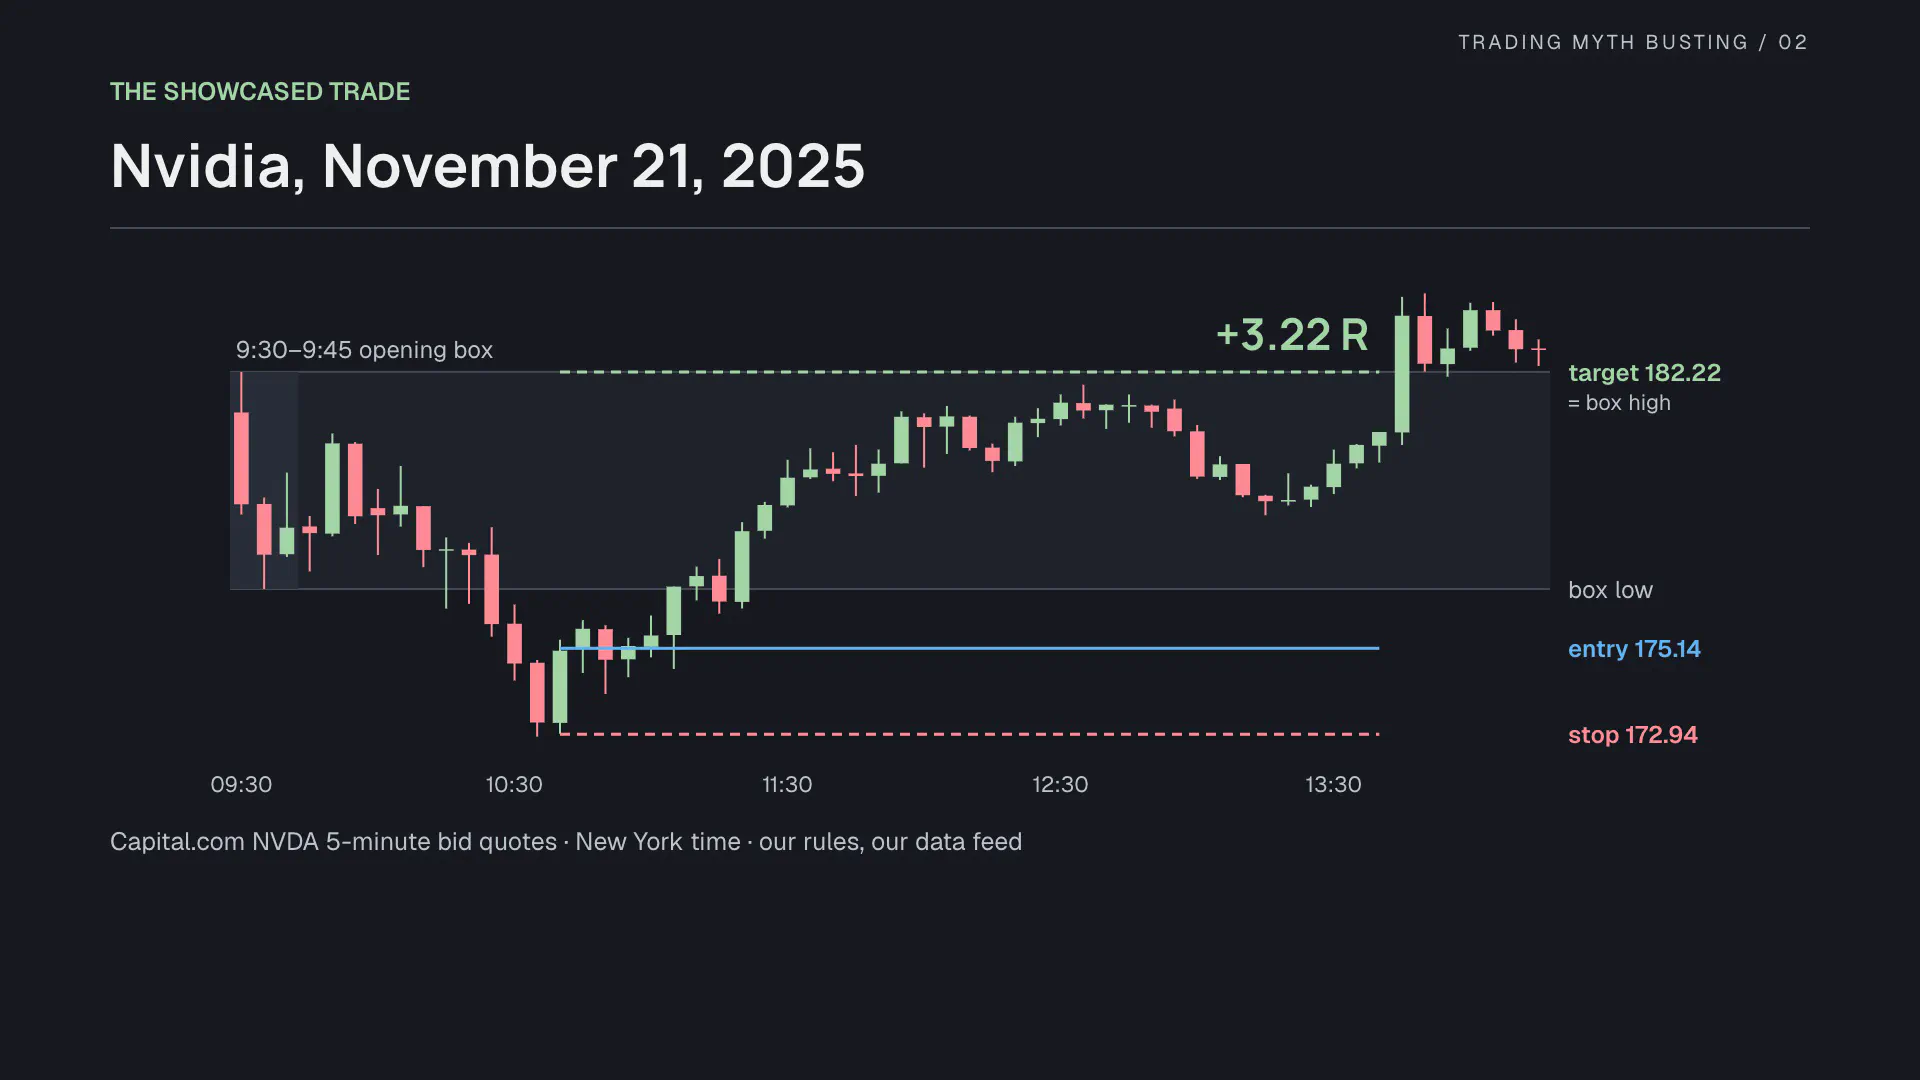
The strategy comes from ProRealAlgos’ The “ONE CANDLE” Scalping Strategy I Will Use For Life, published December 7, 2025. Its centerpiece is a single trade: Nvidia on November 21, 2025. The first fifteen minutes build a box, price breaks below it, a reversal candle closes outside, the long entry fills at 175.14 with a stop at 172.94, and three hours later the target at 182.22 is hit. That is 3.22 times the risk.
We test trading claims the same way every time: write the rules as code, run them on fixed data, keep every result. The question here is not whether the example happened. It did. The question is what it represents.
The rules as code
The rules are mechanical, which is what makes them testable:
- The box is the 9:30–9:45 New York range: the first three five-minute candles.
- The box must be at least 25% of the previous completed daily ATR(14).
- A box that closed up looks for shorts above it; a box that closed down looks for longs below it.
- The signal is a hammer or an engulfing candle with its body fully outside the box. The entry is a market order after that five-minute candle closes.
- New entries stop at 11:00, one filled trade per day, and anything still open closes at the session’s end.
Two lines decide this episode. The stop goes one tick beyond the signal candle, and the target is the far side of the box:
float candleStop = longSide ? low - stopBufferTicks * syminfo.mintick : high + stopBufferTicks * syminfo.mintick
float prospectiveTarget = switch targetMode
    "Far boundary" => longSide ? rangeHigh : rangeLow
    "Near boundary" => longSide ? rangeLow : rangeHigh
That stop is very close to the entry. Keep it in mind for the cost section.
The example in context
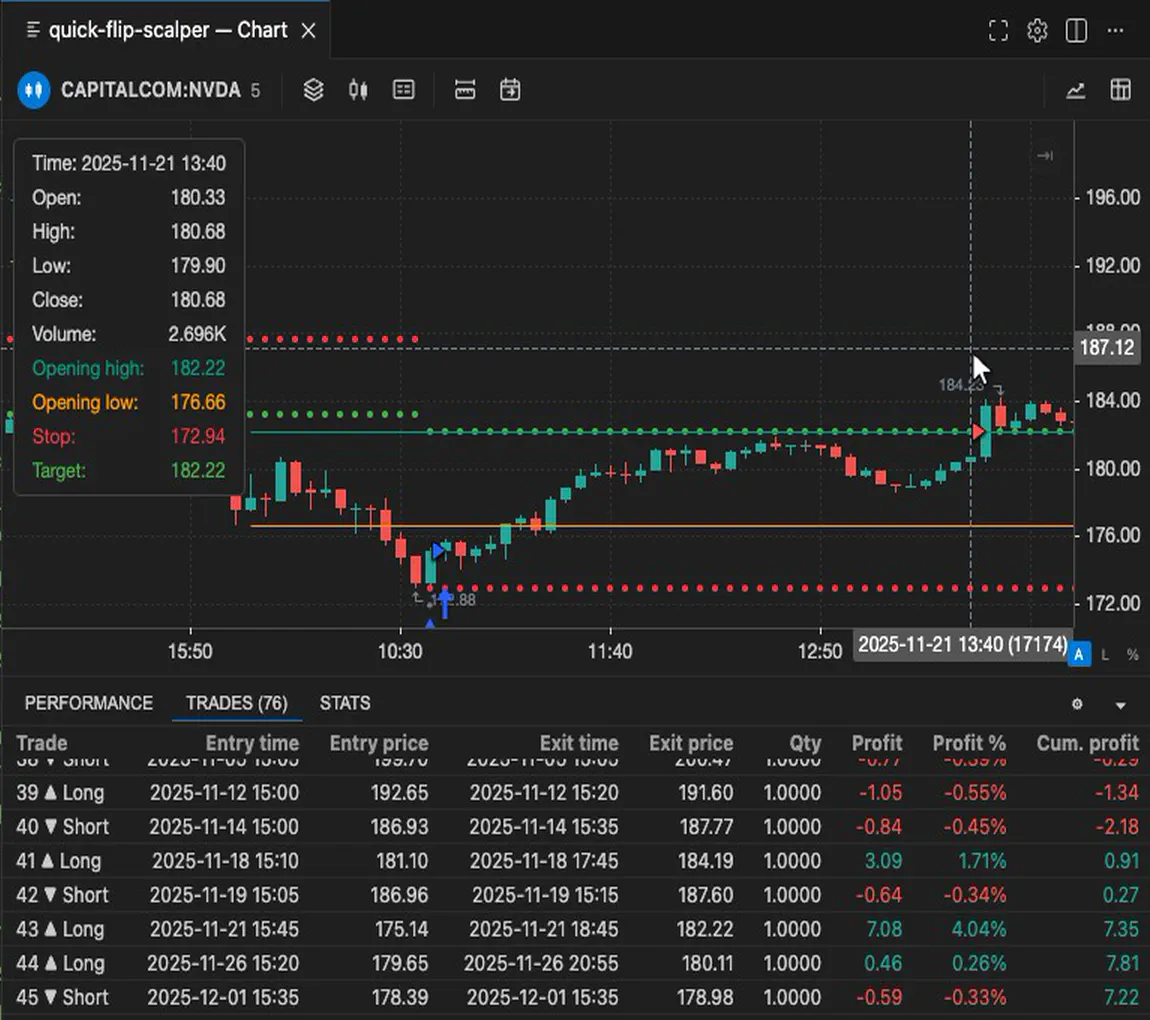
Run on the same Nvidia data, the rules produce the showcased trade with the same date, the same levels and the same +3.22 R. Selecting it in the trade list puts it on the chart: the box, the signal, the entry and the target the strategy actually filled. The trade list shows UTC, so its 15:45 entry is 10:45 in New York.
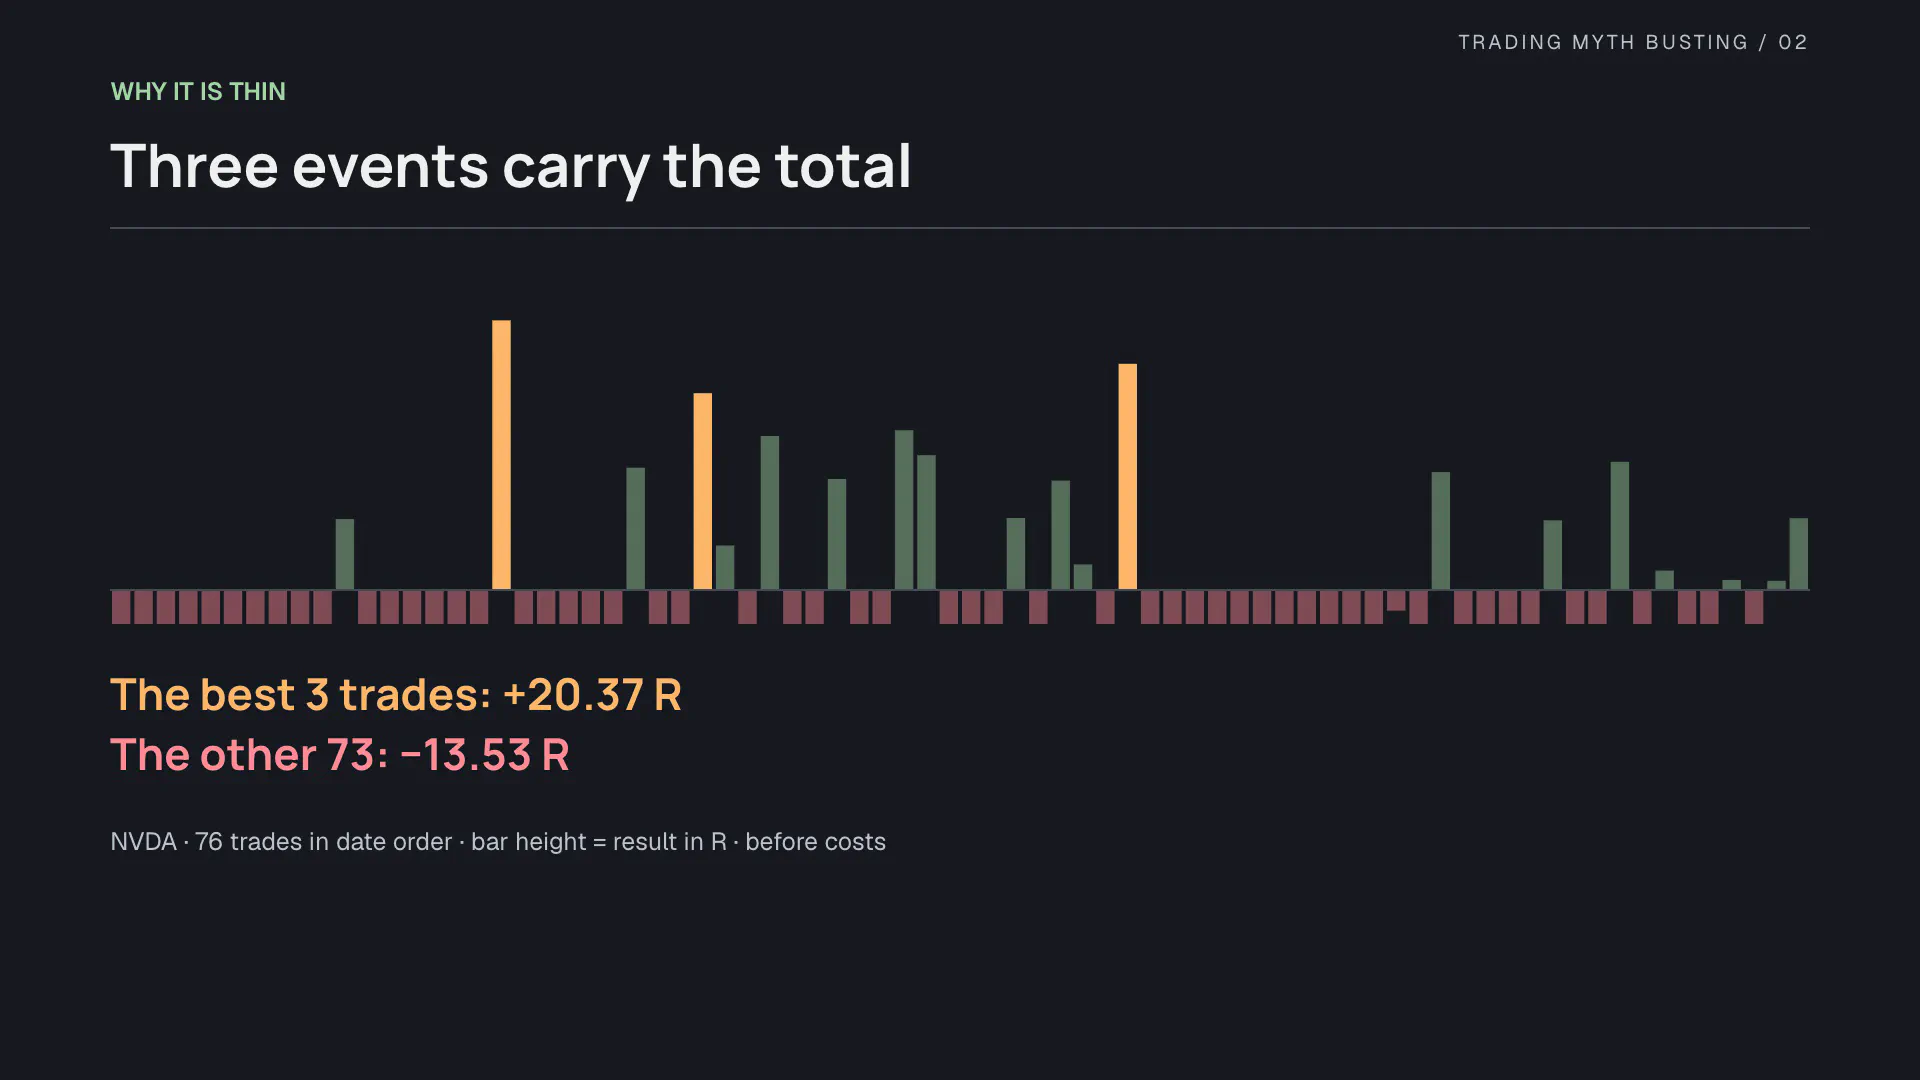
Now order all 76 Nvidia trades by result. The showcased trade is 11th, better than 86% of them. 56 trades lost, 55 of them exactly −1 R: a stop-out. The median trade is −1 R.
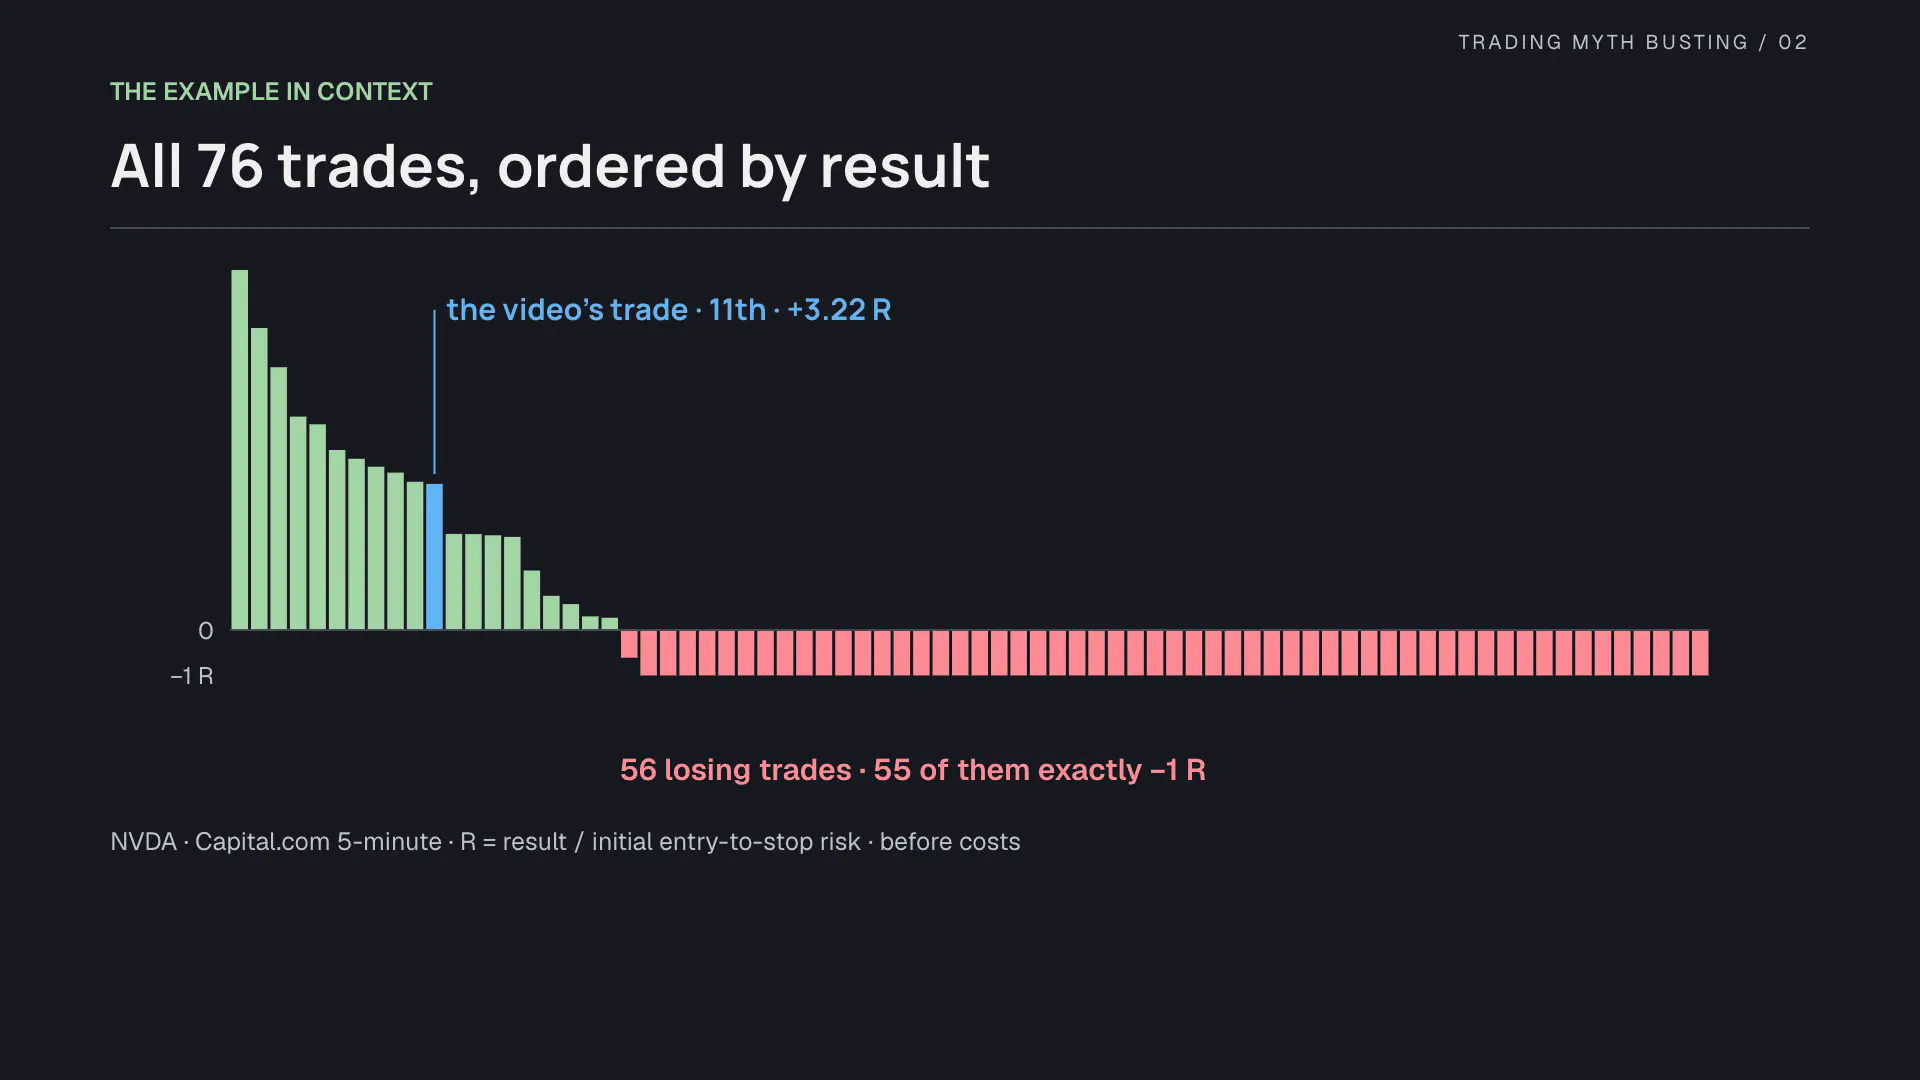
That is not a flaw in the example. A target at the far side of the box pays several times the risk, so most trades are supposed to lose. Nvidia wins 26.3% of the time; the other five stocks win between 12.1% and 22.1%. The showcased trade is a fair picture of the strategy’s good days. The question is what all the days add up to.
Six stocks, three trades
Same rules, same costs (none yet), six large US stocks and the US 100 index as a separate comparison, January 2025 through October 2026:
| Instrument | Trades | Win rate | Gross R | Profit factor | Max drawdown R | Best three R | Without best three R |
|---|---|---|---|---|---|---|---|
| Nvidia | 76 | 26.3% | +6.84 | 1.12 | 13.91 | +20.37 | −13.53 |
| Apple | 92 | 16.3% | −24.61 | 0.68 | 25.21 | +19.60 | −44.21 |
| Microsoft | 95 | 14.7% | −12.60 | 0.84 | 26.62 | +28.07 | −40.66 |
| Tesla | 104 | 22.1% | +3.00 | 1.04 | 26.83 | +21.03 | −18.02 |
| JPMorgan | 90 | 20.0% | +3.72 | 1.05 | 27.29 | +29.66 | −25.94 |
| Exxon Mobil | 91 | 12.1% | −34.67 | 0.56 | 34.67 | +18.35 | −53.02 |
| US 100 (index) | 86 | 17.4% | −4.09 | 0.94 | 16.23 | +23.37 | −27.46 |
Three of the six stocks made money before costs. Remove each instrument’s three best trades and every row turns negative, all seven of them. Nvidia’s +6.84 R becomes −13.53 R.
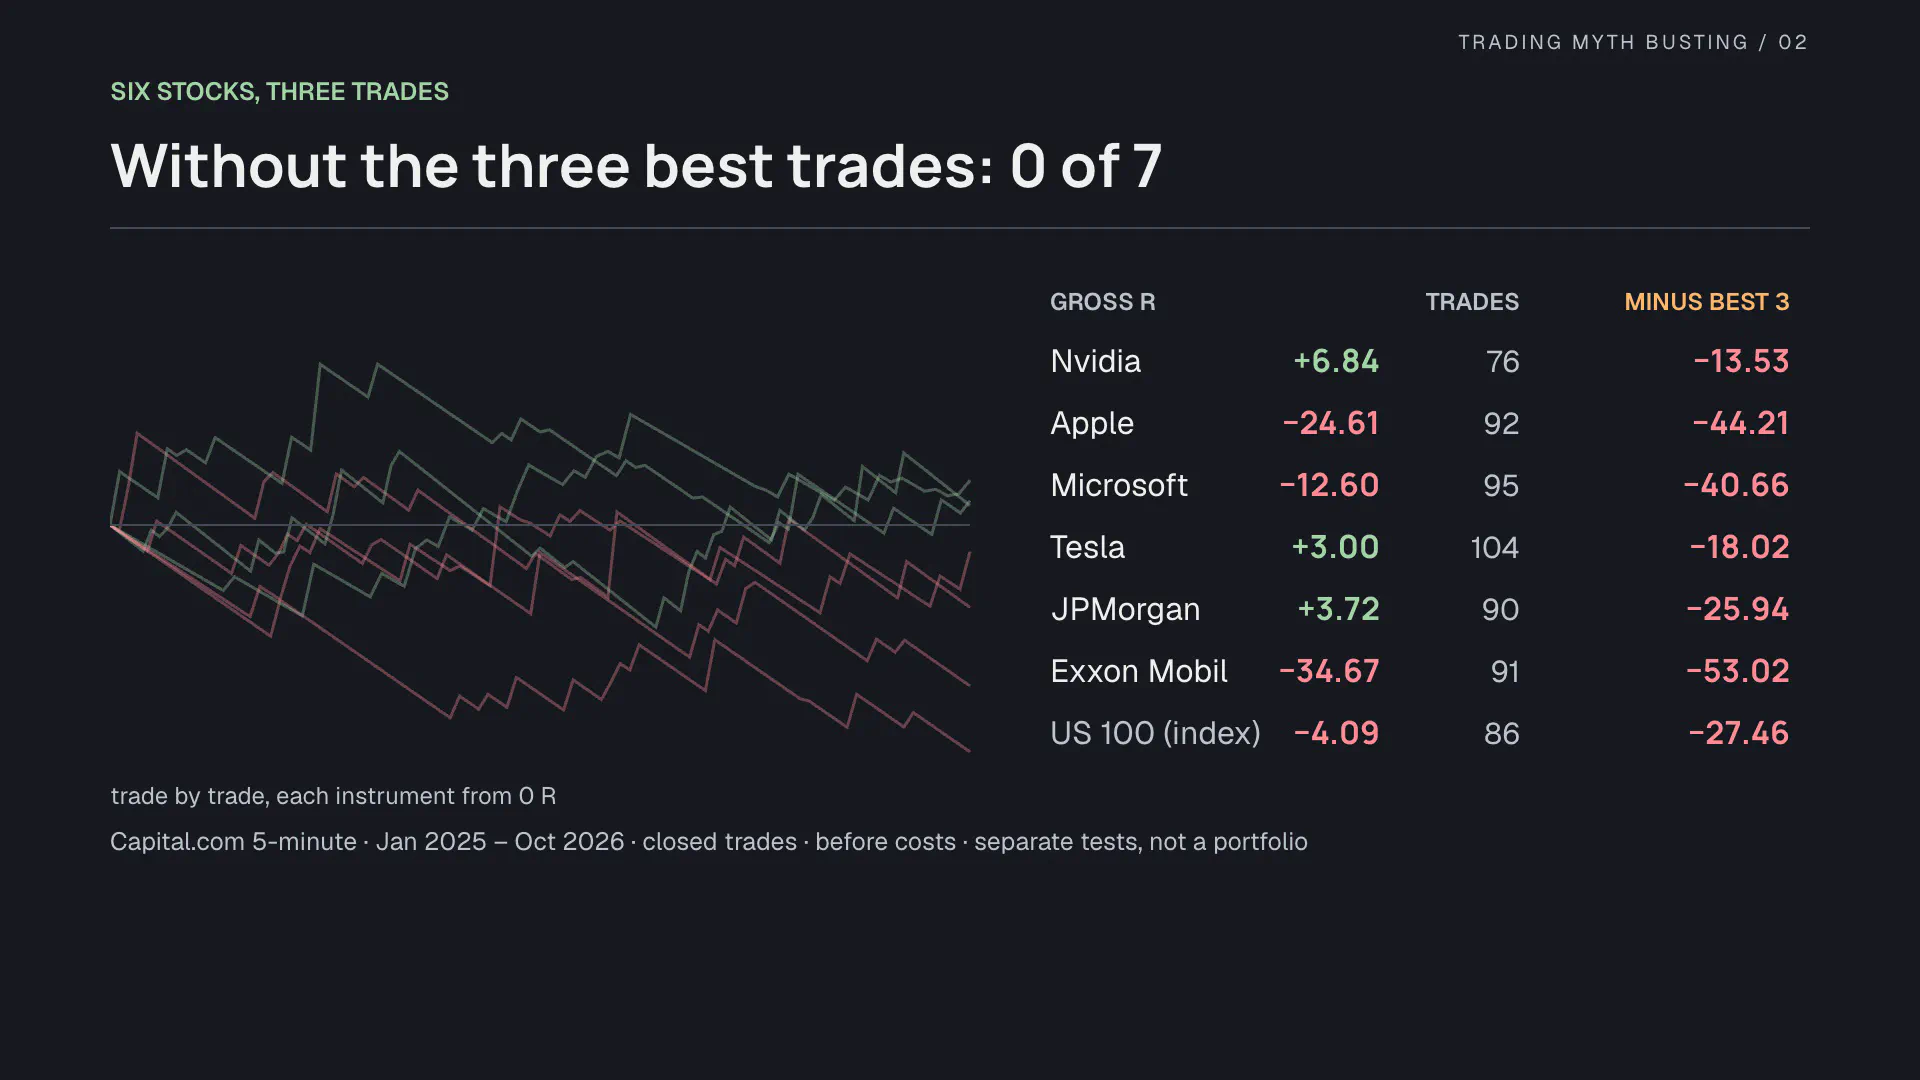
On Nvidia, three trades carry +20.37 R; the other 73 lose 13.53 R together. Each positive total rests on three events, which is a thin basis for a strategy you would trade every morning.
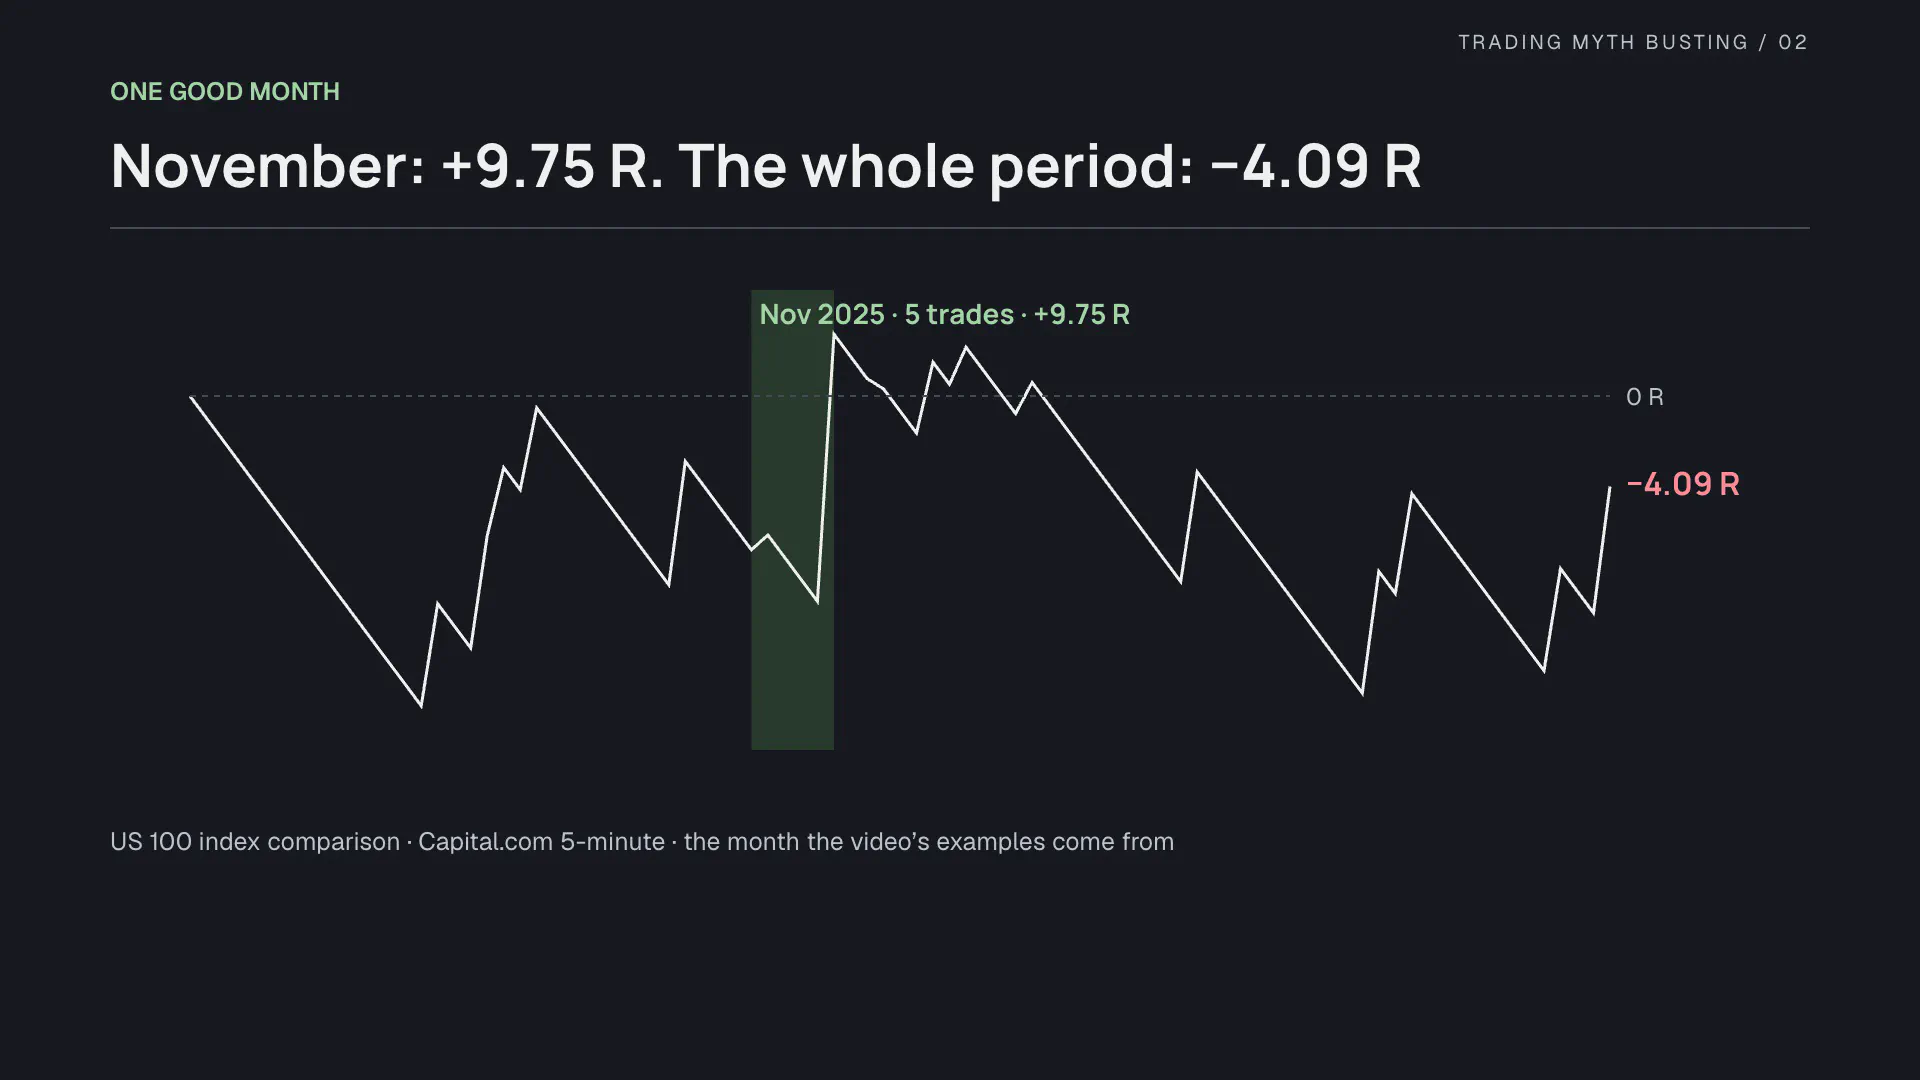
One more pattern explains why a strategy like this can look convincing. On the US 100, November 2025, the month the video’s examples come from, made +9.75 R over 5 trades. The full period on the same index ends at −4.09 R. A good month can be entirely real and still not describe the strategy.
What the edge is worth
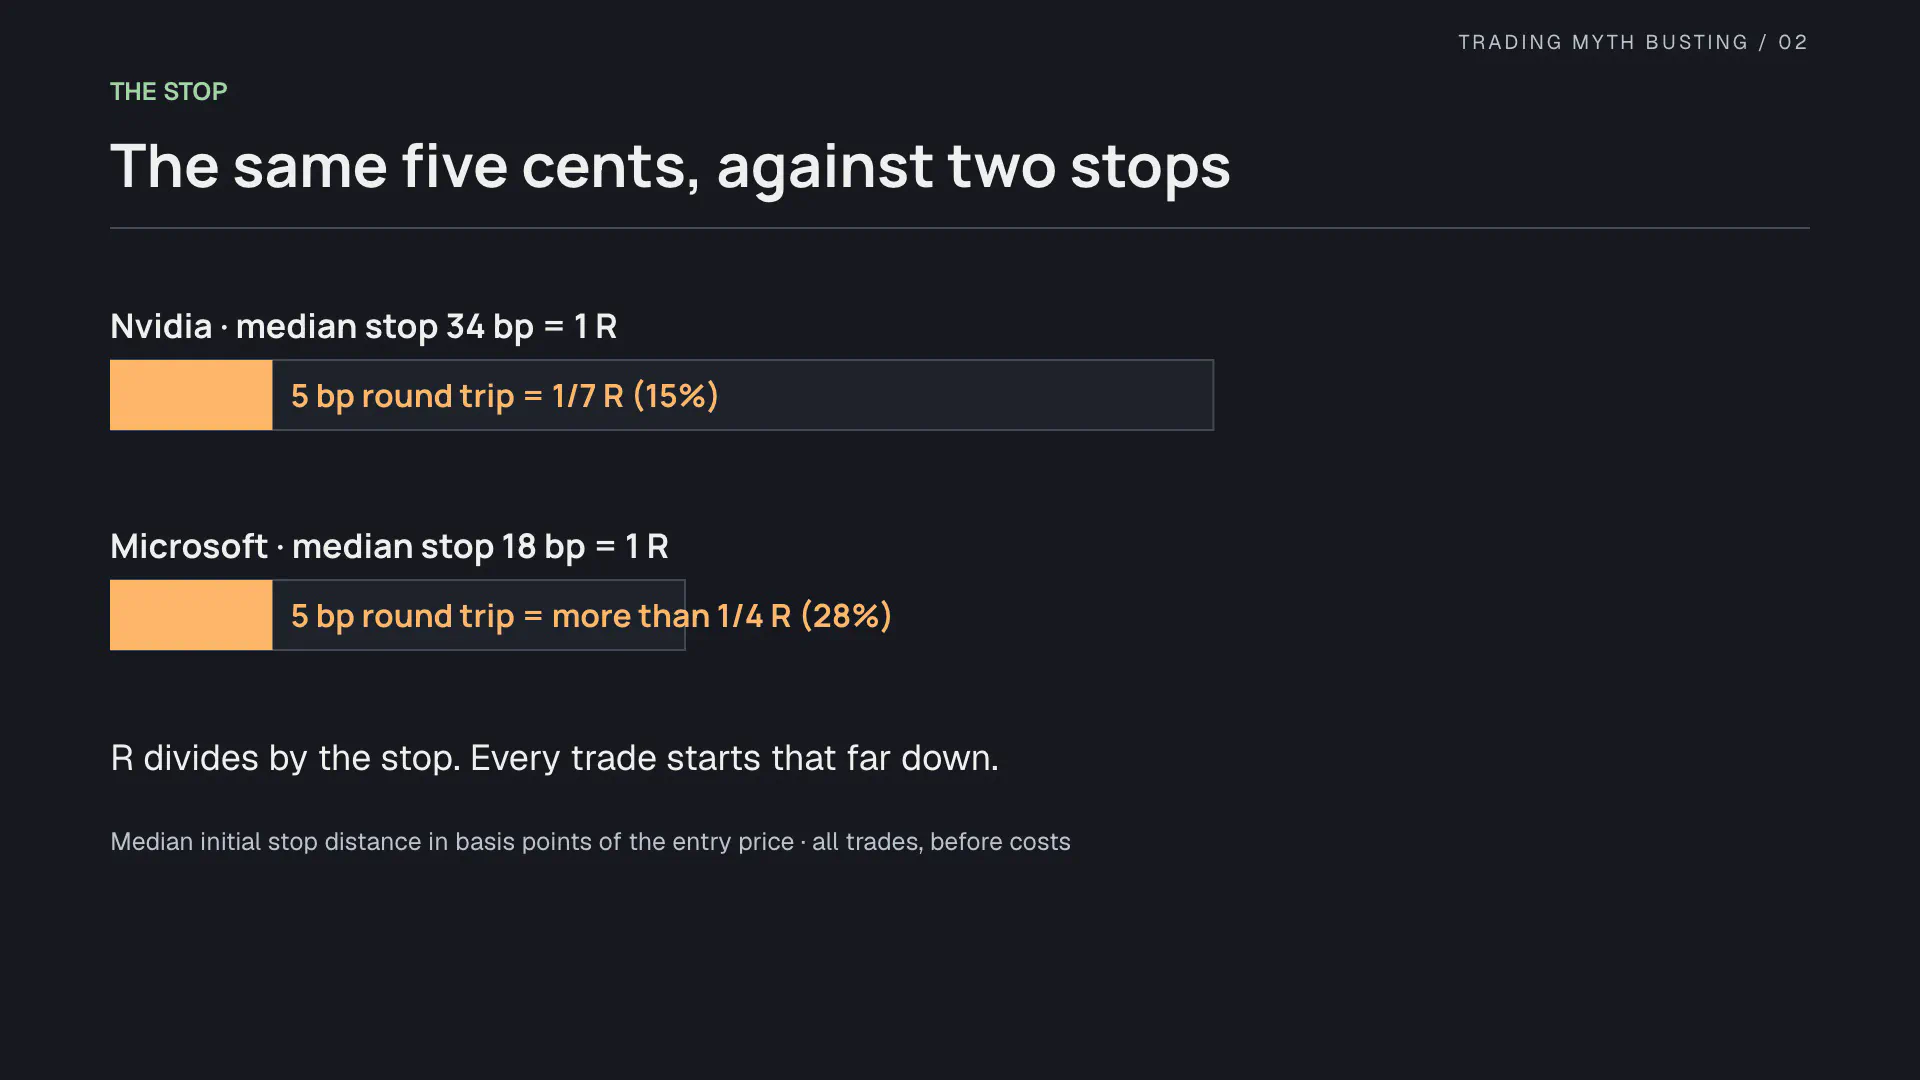
R divides each result by the distance to the stop, so a tight stop makes every fixed cost large in R. One tick beyond a five-minute candle is about as tight as a stop gets: on Nvidia the median stop is 34 basis points of the share price, on Microsoft 18. A 5-basis-point round trip, five cents on a one-hundred-dollar stock, is a seventh of one R on Nvidia and more than a quarter of one R on Microsoft.
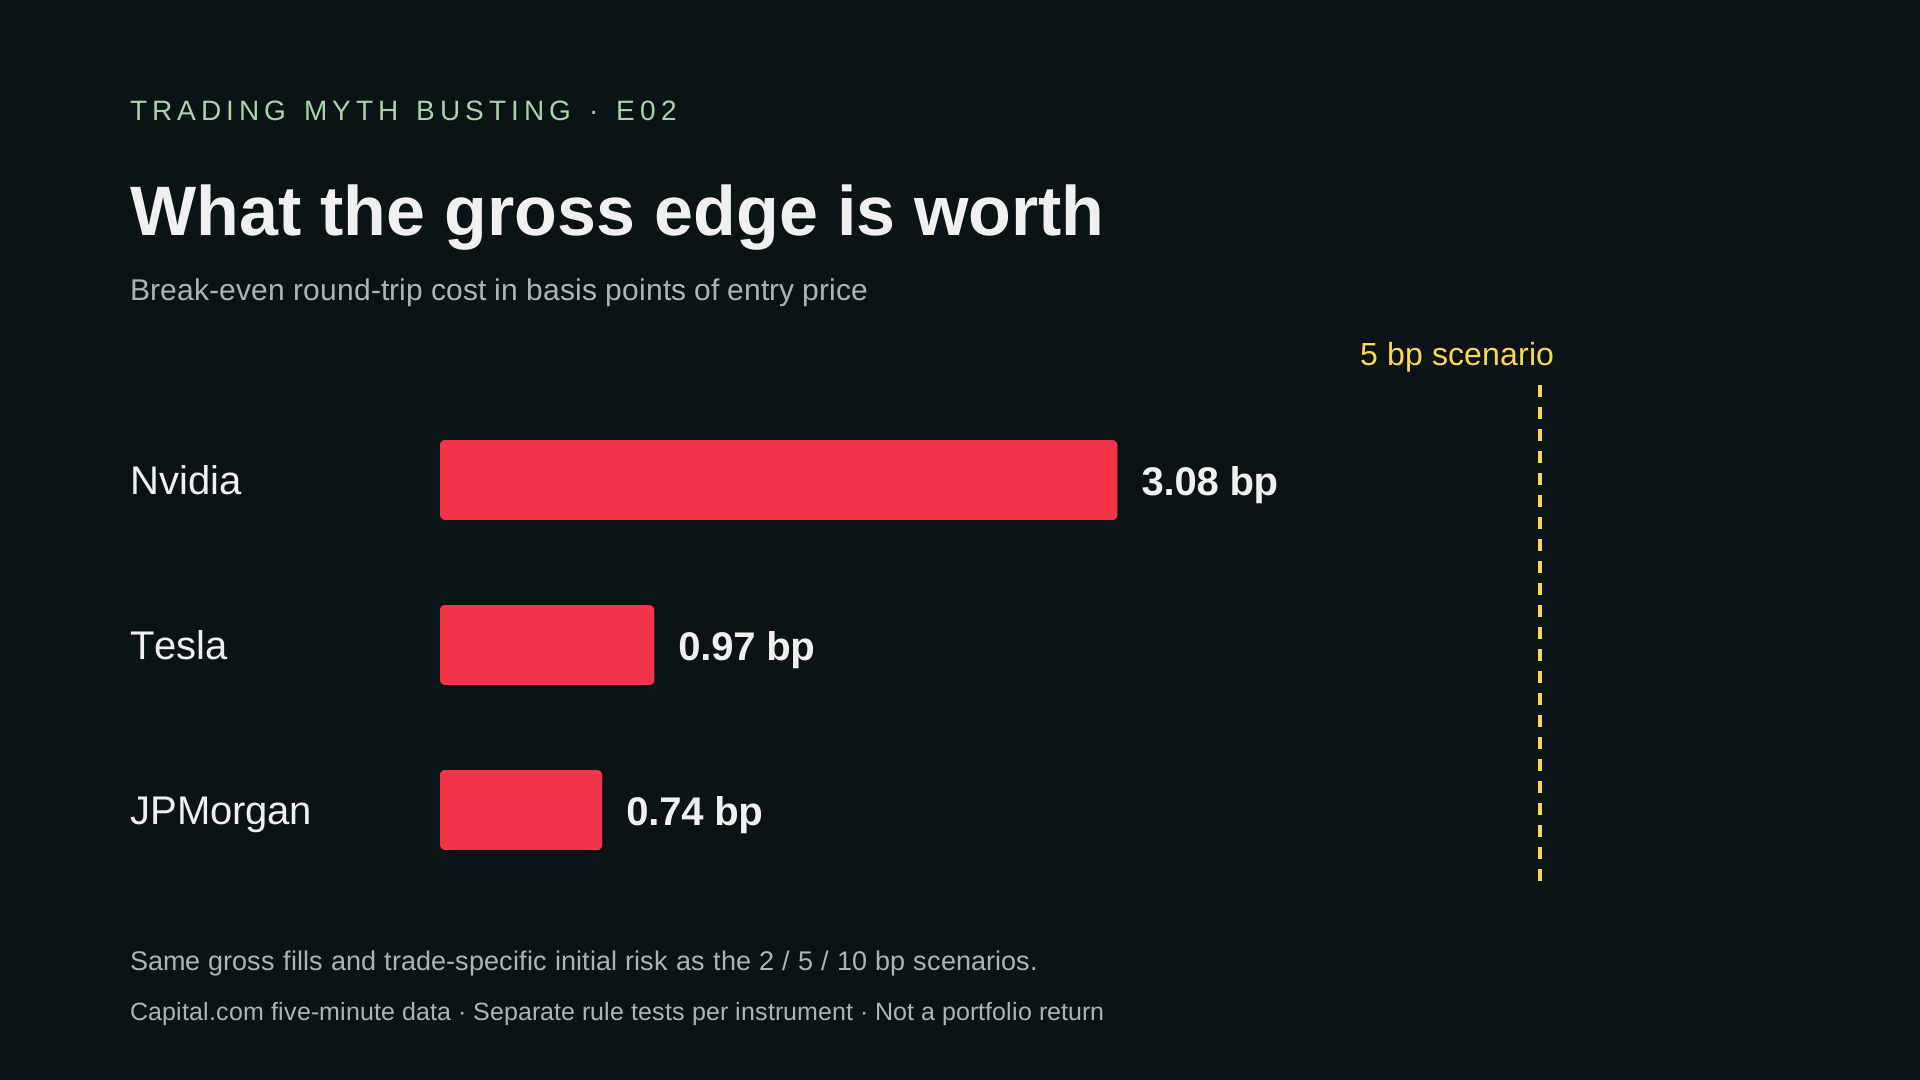
For each positive stock, this is the round-trip cost that erases the gross result exactly:
| Stock | Gross R | Breakeven round-trip cost |
|---|---|---|
| Nvidia | +6.84 | 3.08 bp |
| Tesla | +3.00 | 0.97 bp |
| JPMorgan | +3.72 | 0.74 bp |
None reaches five basis points. These thresholds account for each trade’s entry price and initial stop distance, matching the percentage-of-price cost scenarios below.
Here is the whole panel at three flat cost scenarios:
| Instrument | Gross R | 2 bp R | 5 bp R | 10 bp R |
|---|---|---|---|---|
| Nvidia | +6.84 | +2.40 | −4.27 | −15.37 |
| Apple | −24.61 | −34.91 | −50.36 | −76.11 |
| Microsoft | −12.60 | −24.95 | −43.48 | −74.36 |
| Tesla | +3.00 | −3.16 | −12.41 | −27.82 |
| JPMorgan | +3.72 | −6.37 | −21.52 | −46.76 |
| Exxon Mobil | −34.67 | −44.23 | −58.56 | −82.44 |
| US 100 (index) | −4.09 | −20.12 | −44.17 | −84.25 |
At 5 basis points Nvidia’s +6.84 becomes −4.27 R, and none of the six stocks is positive. On Nvidia that cost is 0.15 R per trade, or 11 R across the 76 trades, more than the entire gross result. Only Nvidia survives 2 basis points. These are cost scenarios, not a record of what every fill would have paid.
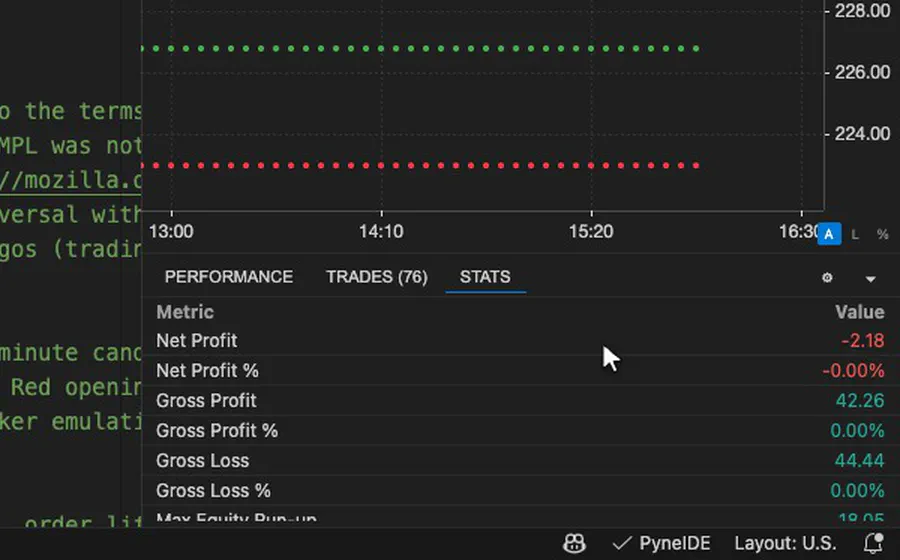
In the product the same scenario takes one field: set the commission to 0.025% of order value on each side in the strategy properties and run it again. Trading one share per signal, Nvidia’s net profit of 4.39 dollars across the 76 trades turns into a loss of 2.18.
Why does position sizing not fix this? Sizing changes how much money each trade puts at risk. It does not change whether the expected result per unit of risk is negative, and after costs it is.
Before and after the video
The video was published on December 7, 2025, so part of our data came before it and part after. Splitting at December 8:
| Instrument | Before: trades | Before: gross R | After: trades | After: gross R |
|---|---|---|---|---|
| Nvidia | 45 | +10.26 | 31 | −3.42 |
| Apple | 41 | −9.55 | 51 | −15.06 |
| Microsoft | 51 | −8.33 | 44 | −4.26 |
| Tesla | 58 | −7.59 | 46 | +10.60 |
| JPMorgan | 48 | +12.54 | 42 | −8.81 |
| Exxon Mobil | 45 | −25.29 | 46 | −9.38 |
| US 100 (index) | 40 | +1.80 | 46 | −5.88 |
Nvidia was positive before the video and negative after; Tesla the other way around. That does not imply deliberate selection, and we do not know the creator’s full test window or trade history. Both halves are short, and the split mostly shows how much a total of a few R moves with a handful of trades.
Ideas from the comments
Viewers suggested useful experiments: require stronger volume at the reversal, wait for another candle to confirm, and use a different opening-range threshold on another market. The script carries the first two as explicit switches, both off by default:
- Volume filter: the signal candle’s volume must exceed the mean of the previous 20 complete signal candles.
- Extra confirmation: the next completed five-minute candle must close beyond the signal candle’s extreme, keeping the original stop.
These are hypotheses, not fixes we have shown to work. All results above use the baseline with both switches off. A commenter’s lower ATR threshold for futures is also not a reason to quietly change the rules of a stock test; the threshold is an input, and each experiment should be named and kept separate.
What the test supports
The rules are complete and testable, and the showcased trade reproduces exactly. But the gross profit on three of six stocks rests on their best three trades, and the edge that survived is worth less than a nickel per hundred dollars of stock, less than this strategy spends on its own stop. What would change that answer is specific: a named instrument, a filter defined in advance, realistic execution, and a fresh period.
Reproduce it
- The script: Quick Flip Scalper on TradingView. The default setup is the tested baseline; the volume filter, the extra confirmation, the near-boundary target and two other entry interpretations are inputs. Pine source, MPL-2.0.
- The numbers: results-by-instrument.csv holds every figure in the tables above, per instrument: trades, win rate, gross R, profit factor, drawdown, the best three trades, breakeven cost, the 2, 5 and 10 bp scenarios and the before/after split.
- The IDE in the video: PyneIDE, our IDE for Pine Script inside Visual Studio Code. It runs scripts locally on PyneCore, the open-source Pine runtime, and fills orders with PyneCore’s own broker emulator.
Data and assumptions. Capital.com bid quotes from its demo API for Nvidia, Apple, Microsoft, Tesla, JPMorgan, Exxon Mobil and the US 100 index CFD, January 2, 2025 – October 2, 2026. Five-minute candles are aggregated from complete runs of five one-minute candles; only full regular sessions are kept, 402–431 per instrument, and missing prices are not filled in. These are broker quotes, not consolidated exchange trades. The daily ATR comes from the provider’s daily candles. Each instrument runs on its own complete sessions, so this is not a perfectly matched daily panel: the seven share 392 complete dates. R is the price result divided by the distance from the actual entry to the initial stop. The 2, 5 and 10 basis-point round-trip costs are scenarios deducted from gross fills, not measured broker costs. Results are separate rule tests per instrument with a fixed one-unit position, not a portfolio return, and adding the R totals does not give the return of a real shared account. The signal-candle geometry, the order timing and the stop rule are our definitions of the video’s rules; our stop comes from a fixed rule, not the creator’s discretionary placement, so the example is a reconstruction, not the creator’s personal result.
If you get a different result, include the symbol, dates, settings and costs so we can compare the experiments.