
Myth Busting · Episode 01
Does the "Best" 5-Minute Scalping Strategy Work?
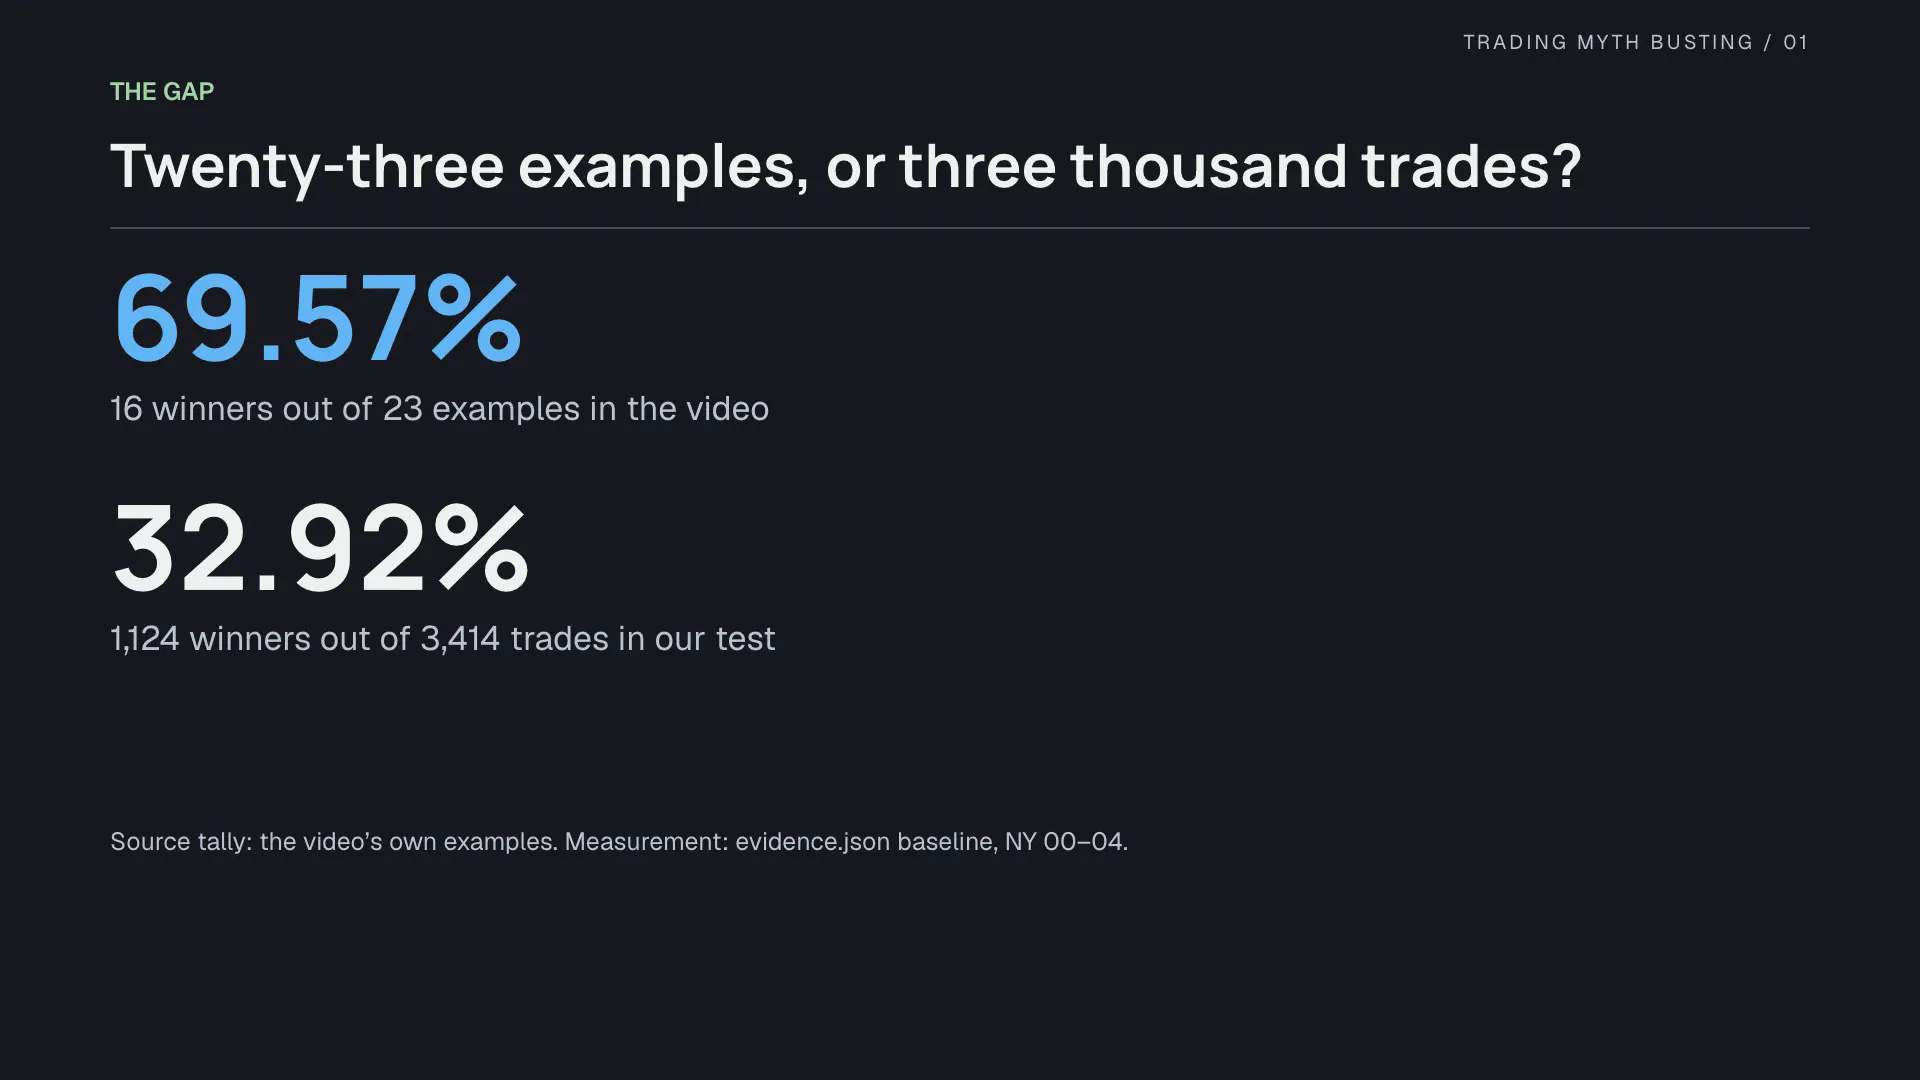
TL;DR: A popular five-minute setup fades the failed breakout of the day’s first 4-hour range. The video teaching it shows 23 examples and 16 winners, a 69.57% hit rate. We turned the rules into code and ran them on bitcoin, gold and EUR/USD: across 3,414 trades the hit rate was 32.92%. A 2R target needs 33.33% just to break even before costs, and each market’s own average cost pushes that to 36% or more. Gold comes closest, and it still falls 1.2 points short. Script, tables and data notes are below.
The claim
The strategy comes from Data Trader’s The BEST 5 Minute Scalping Strategy Ever (Simple and Proven), published August 29, 2025. A breakout fails, price closes back inside the range it just left, and you fade the move with a stop beyond the extreme and a target at twice the risk. The video shows 23 examples, and 16 of them win.
We test trading claims the same way every time: write the rules as code, run them on fixed data, keep every result. We could not identify the dates of the 23 examples, so this is an independent test of the rules, not a reconstruction of those trades. We think the examples are real. The point is that 23 examples and 3,414 trades are not the same measurement.
The rules as code
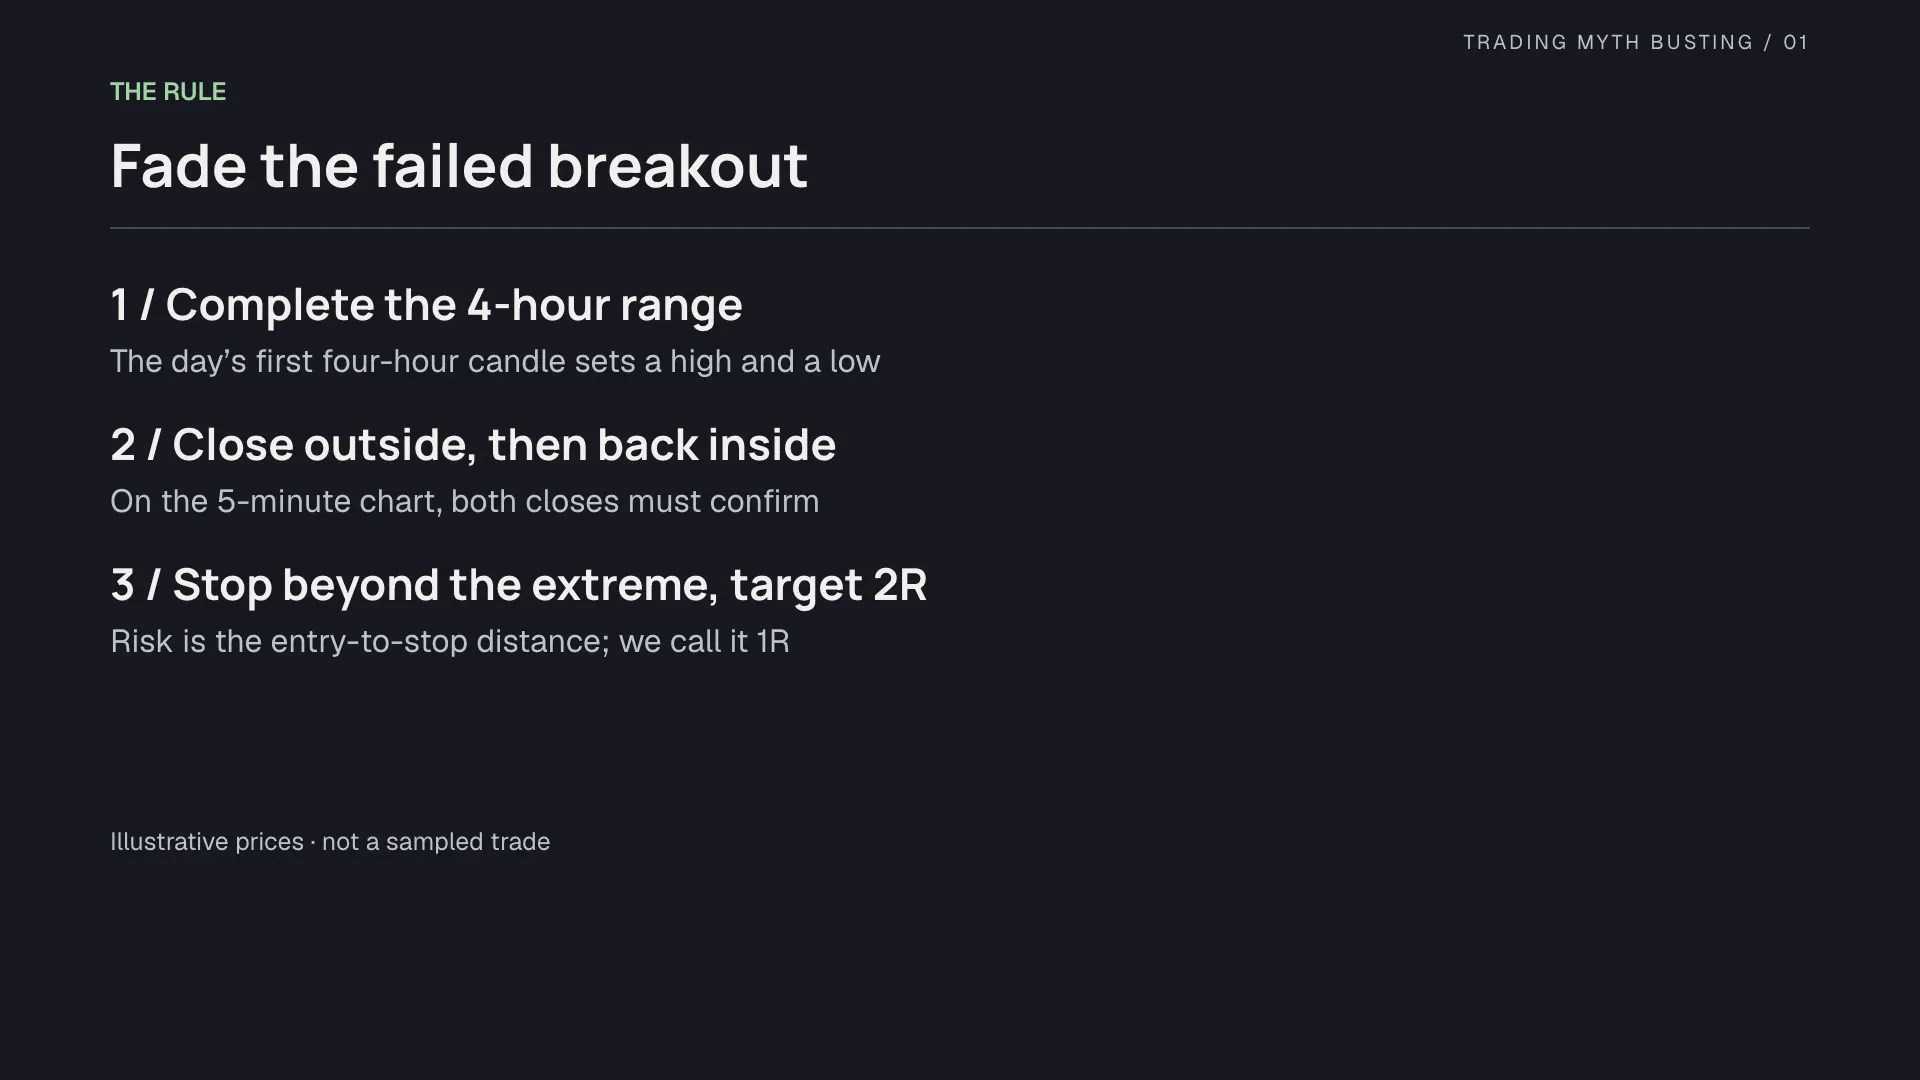
- Wait for the day’s first 4-hour candle to complete. Our results use the New York 00:00–04:00 range.
- On the 5-minute chart, wait for a close outside that range, then a close back inside it.
- Fade the move: a downside breakout gives a long, an upside breakout gives a short.
- The stop goes beyond the breakout extreme; the target is twice the risk. Both are fixed at entry, and only one position is open at a time.
In the script, the re-entry close triggers the trade and the levels follow from the breakout extreme:
float stopPrice = switch stopMode
    "Breakout extreme" => fadeLong ? episodeLow - stopBufferTicks * syminfo.mintick : episodeHigh + stopBufferTicks * syminfo.mintick
    "Fixed price distance" => math.round_to_mintick(fadeLong ? close - fixedStopDistance : close + fixedStopDistance)
candidateStopDistance := fadeLong ? close - stopPrice : stopPrice - close
float targetPrice = math.round_to_mintick(fadeLong ? close + rewardRisk * candidateStopDistance :
     close - rewardRisk * candidateStopDistance)
The rule that is missing
One instruction cannot be coded as stated. When the breakout is too large, the video allows a closer stop at a nearby important level. How large is too large, and which level qualifies? Move the stop and you change the risk, the target, and whether the trade wins at all.

So our baseline keeps the stop at the breakout extreme, every time. That is one explicit interpretation, not a reconstruction of a decision the video never defines.
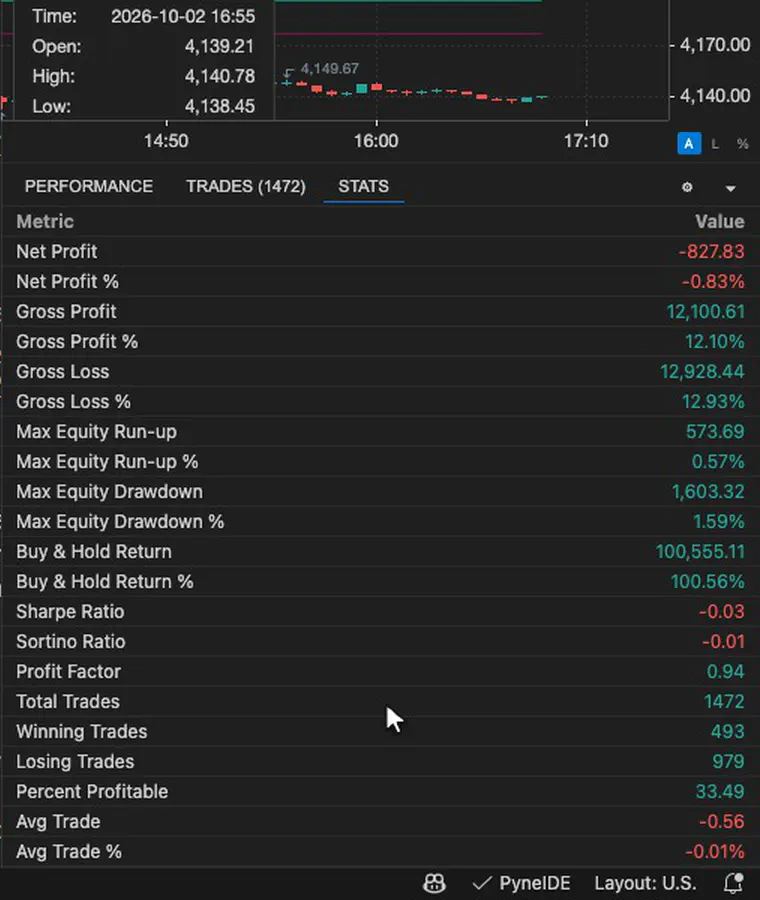
The size limit can be made explicit instead: skip a setup when its stop is wider than a multiple of the ATR. On gold that skips 632 of the original trades, yet the total rises from 1,008 to 1,472, because setups that an open trade used to block now get taken. The filter avoids oversized stops; it does not move them closer. With it on, gold’s hit rate is 33.49%.
The measurement
With a 2R target, one winner in three breaks even: 33.33%. Here is where the three markets land:
| Market | Trades | Hit rate | Gross R | Profit factor |
|---|---|---|---|---|
| EUR/USD | 905 | 32.04% | −38.22 | 0.94 |
| Bitcoin | 1,501 | 32.18% | −52.00 | 0.95 |
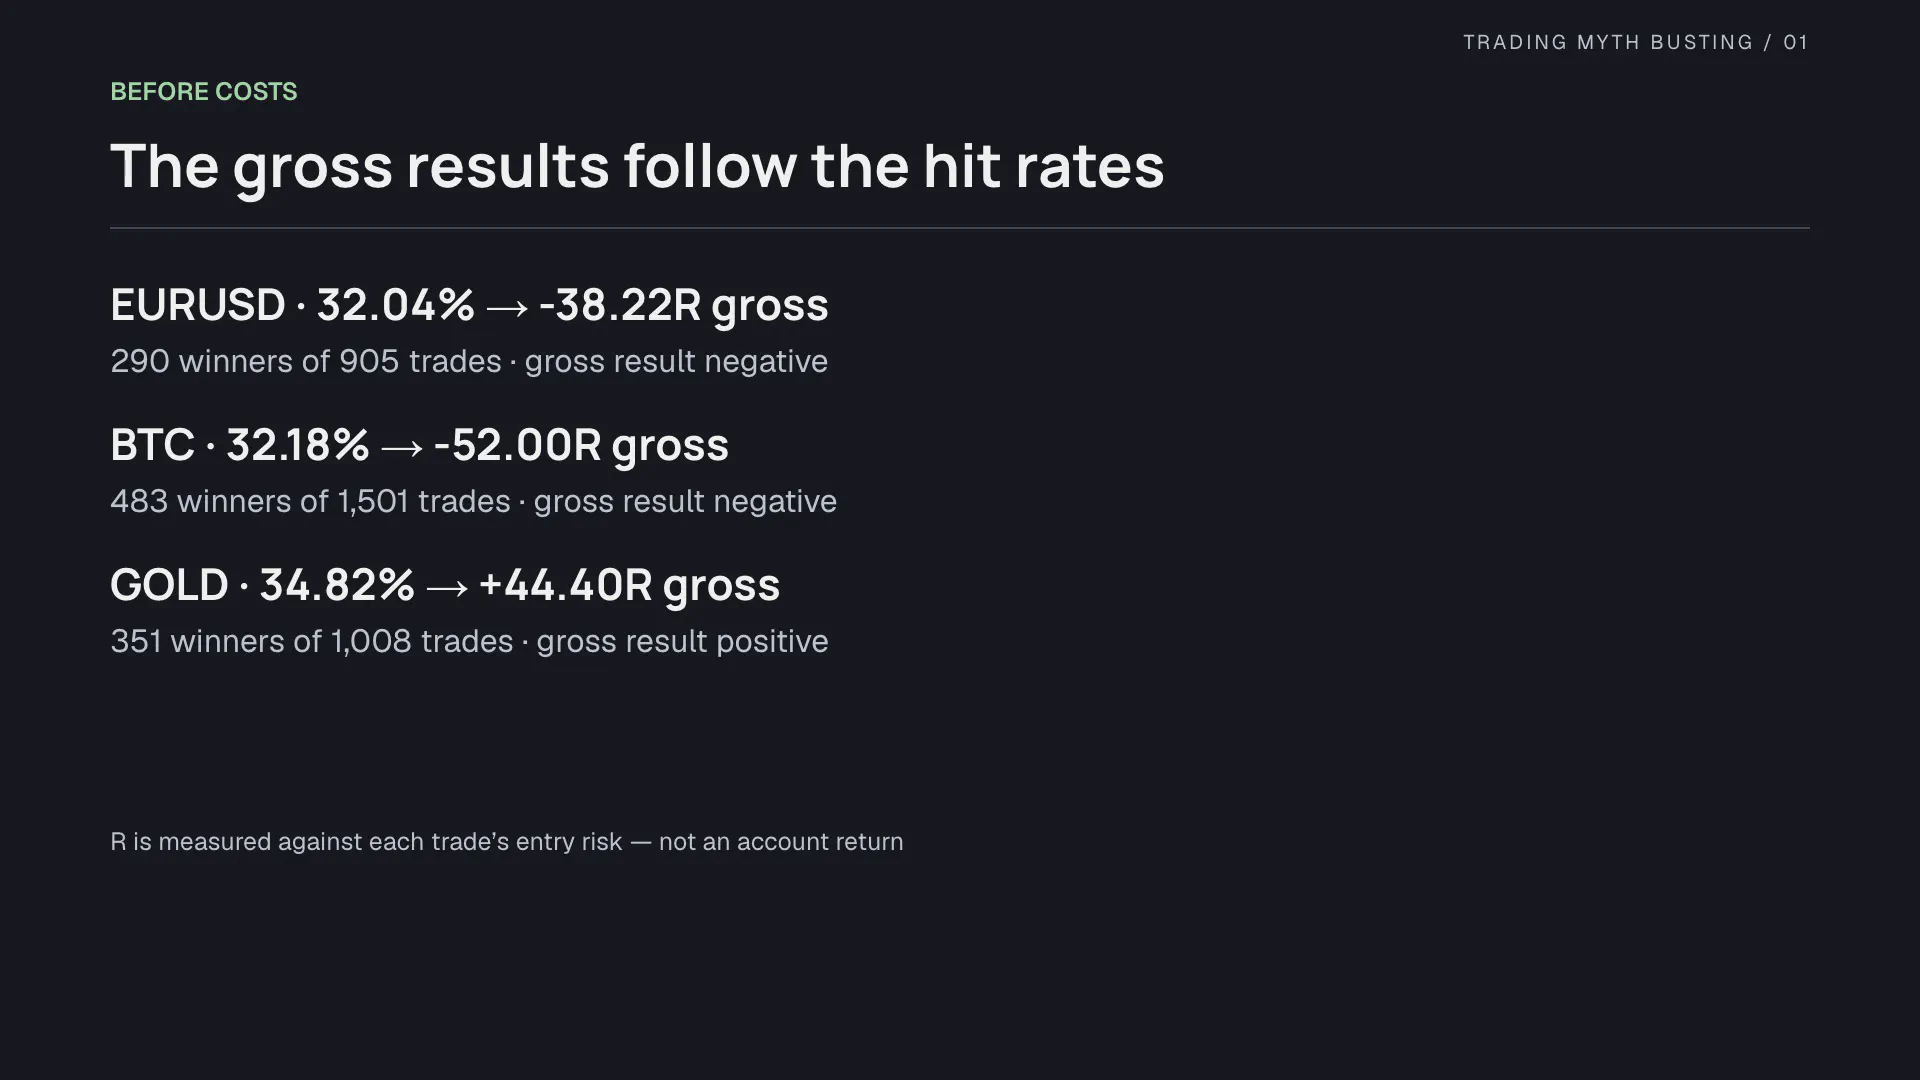
| Gold | 1,008 | 34.82% | +44.40 | 1.07 |
| All | 3,414 | 32.92% |
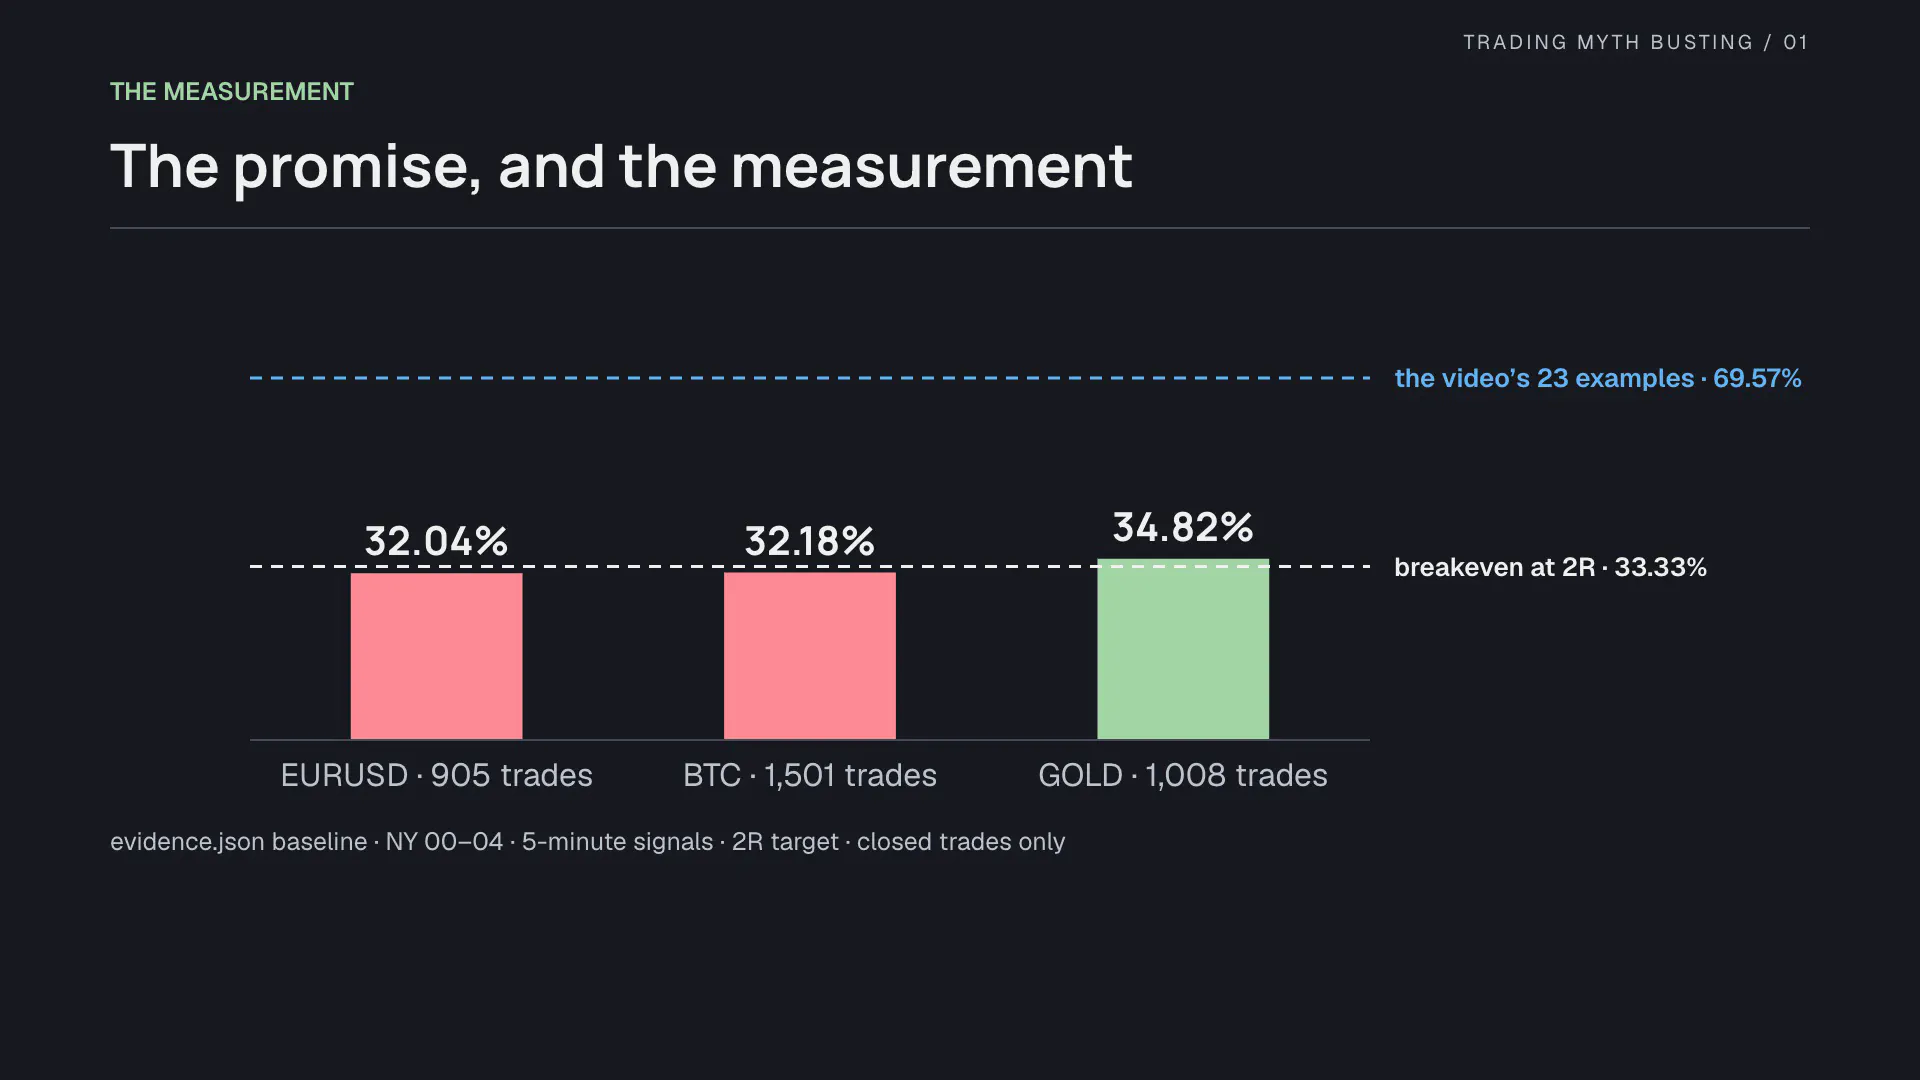
Before costs this strategy is not a disaster. It is sitting on the line, and the gross results follow the hit rates exactly: gold positive, bitcoin and EUR/USD negative. We also checked the implementation against a separate simulator: all 1,008 gold baseline trades matched, entry levels and exits included.
How rare is a 70% run? We slid a window of 23 consecutive trades across each market’s full record, 1,479 windows on bitcoin, 986 on gold and 883 on EUR/USD. Not one of them reached 70% winners. The best 23-trade stretch on every market was 14 of 23, 60.87%. Seven-trade stretches at 70% or better do occur: 66 times on bitcoin, 56 on gold and 31 on EUR/USD. A short, convincing run is easy to find in a long record; it does not describe the record.
What the costs do
33.33% is the requirement with no costs at all. A small fee is a large fraction of a tight stop: with an entry at 100 and a stop 20 cents away, a round-trip fee of about 12 cents eats 0.6 R before the trade has done anything. Using each market’s own average cost, breakeven needs 36.05% on gold, 38.90% on EUR/USD and 46.22% on bitcoin.
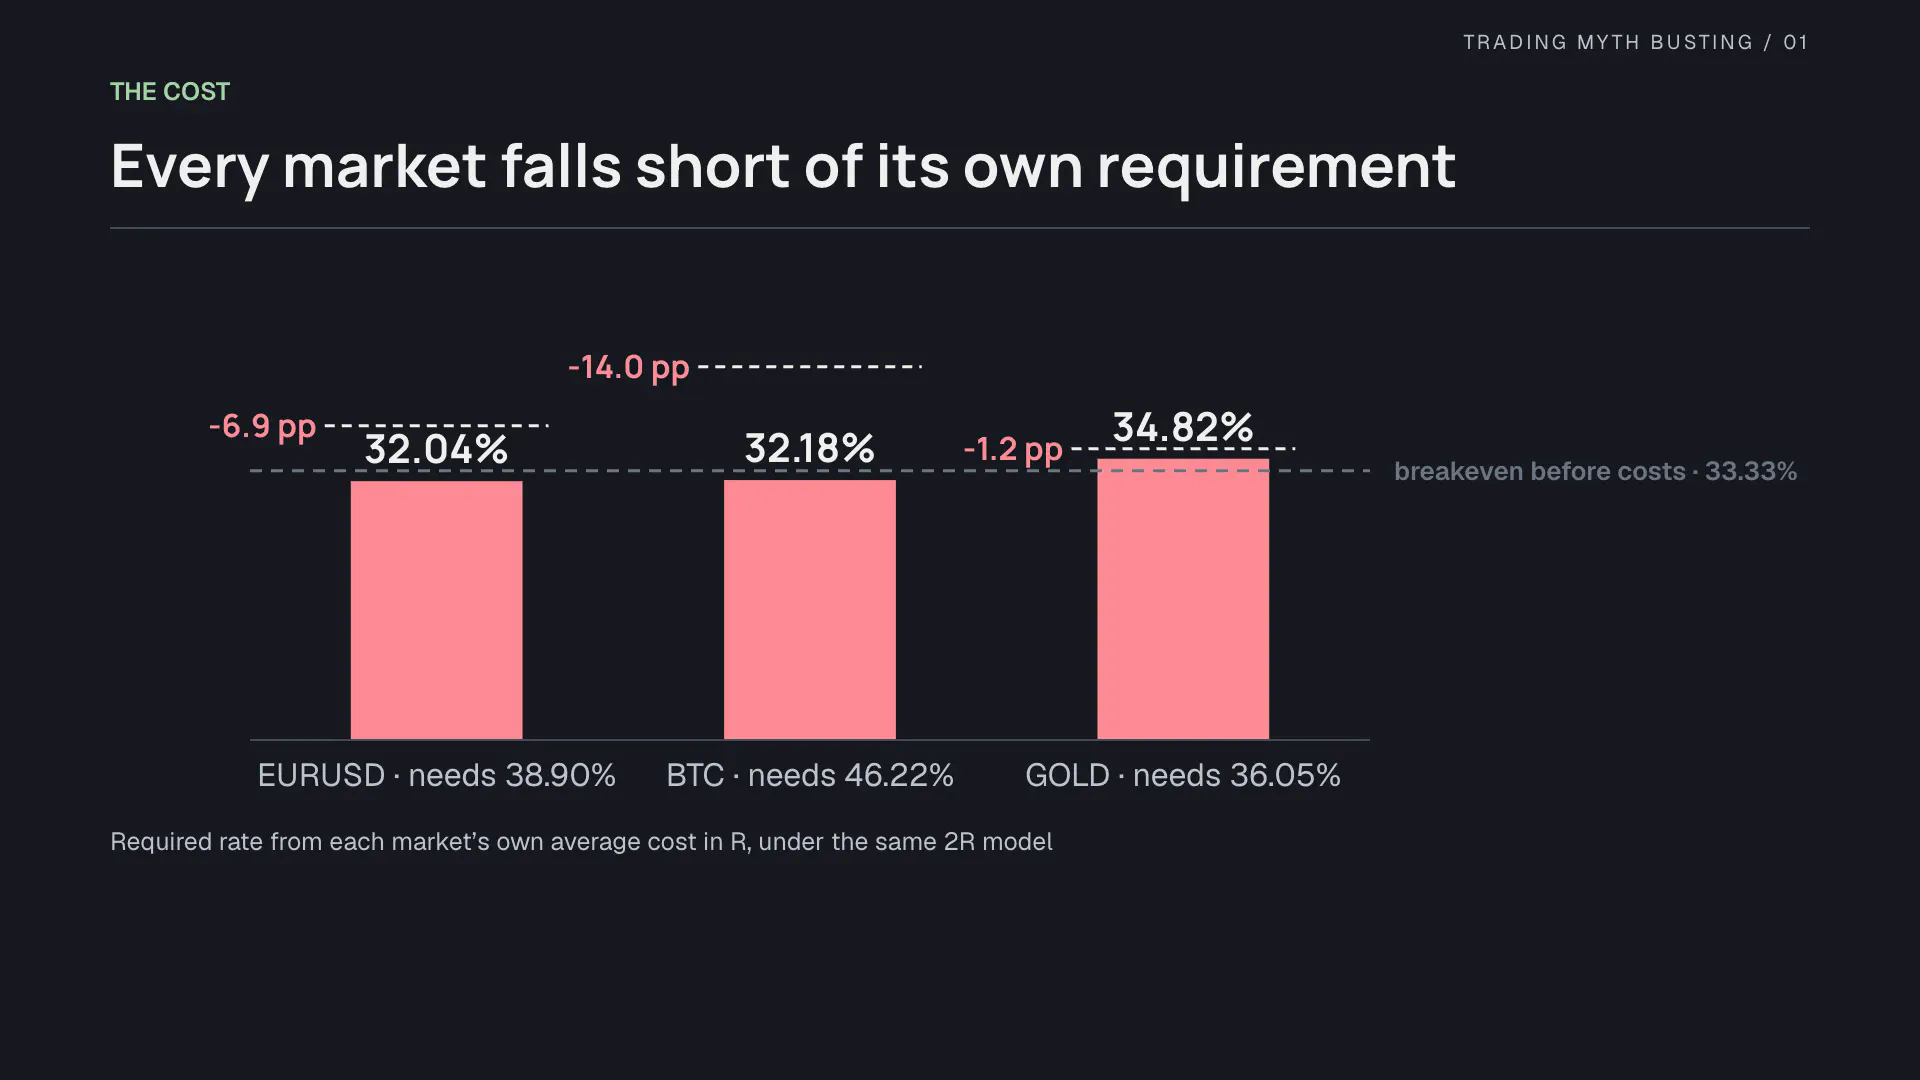
Gold is short by 1.2 percentage points, EUR/USD by 6.9, bitcoin by 14. Gold is the interesting one, because it made money before costs. Scaling our cost estimate:
| Cost scenario | Bitcoin R | Gold R | EUR/USD R |
|---|---|---|---|
| No cost | −52.00 | +44.40 | −38.22 |
| 25% of the estimate | −197.11 | +23.85 | −76.02 |
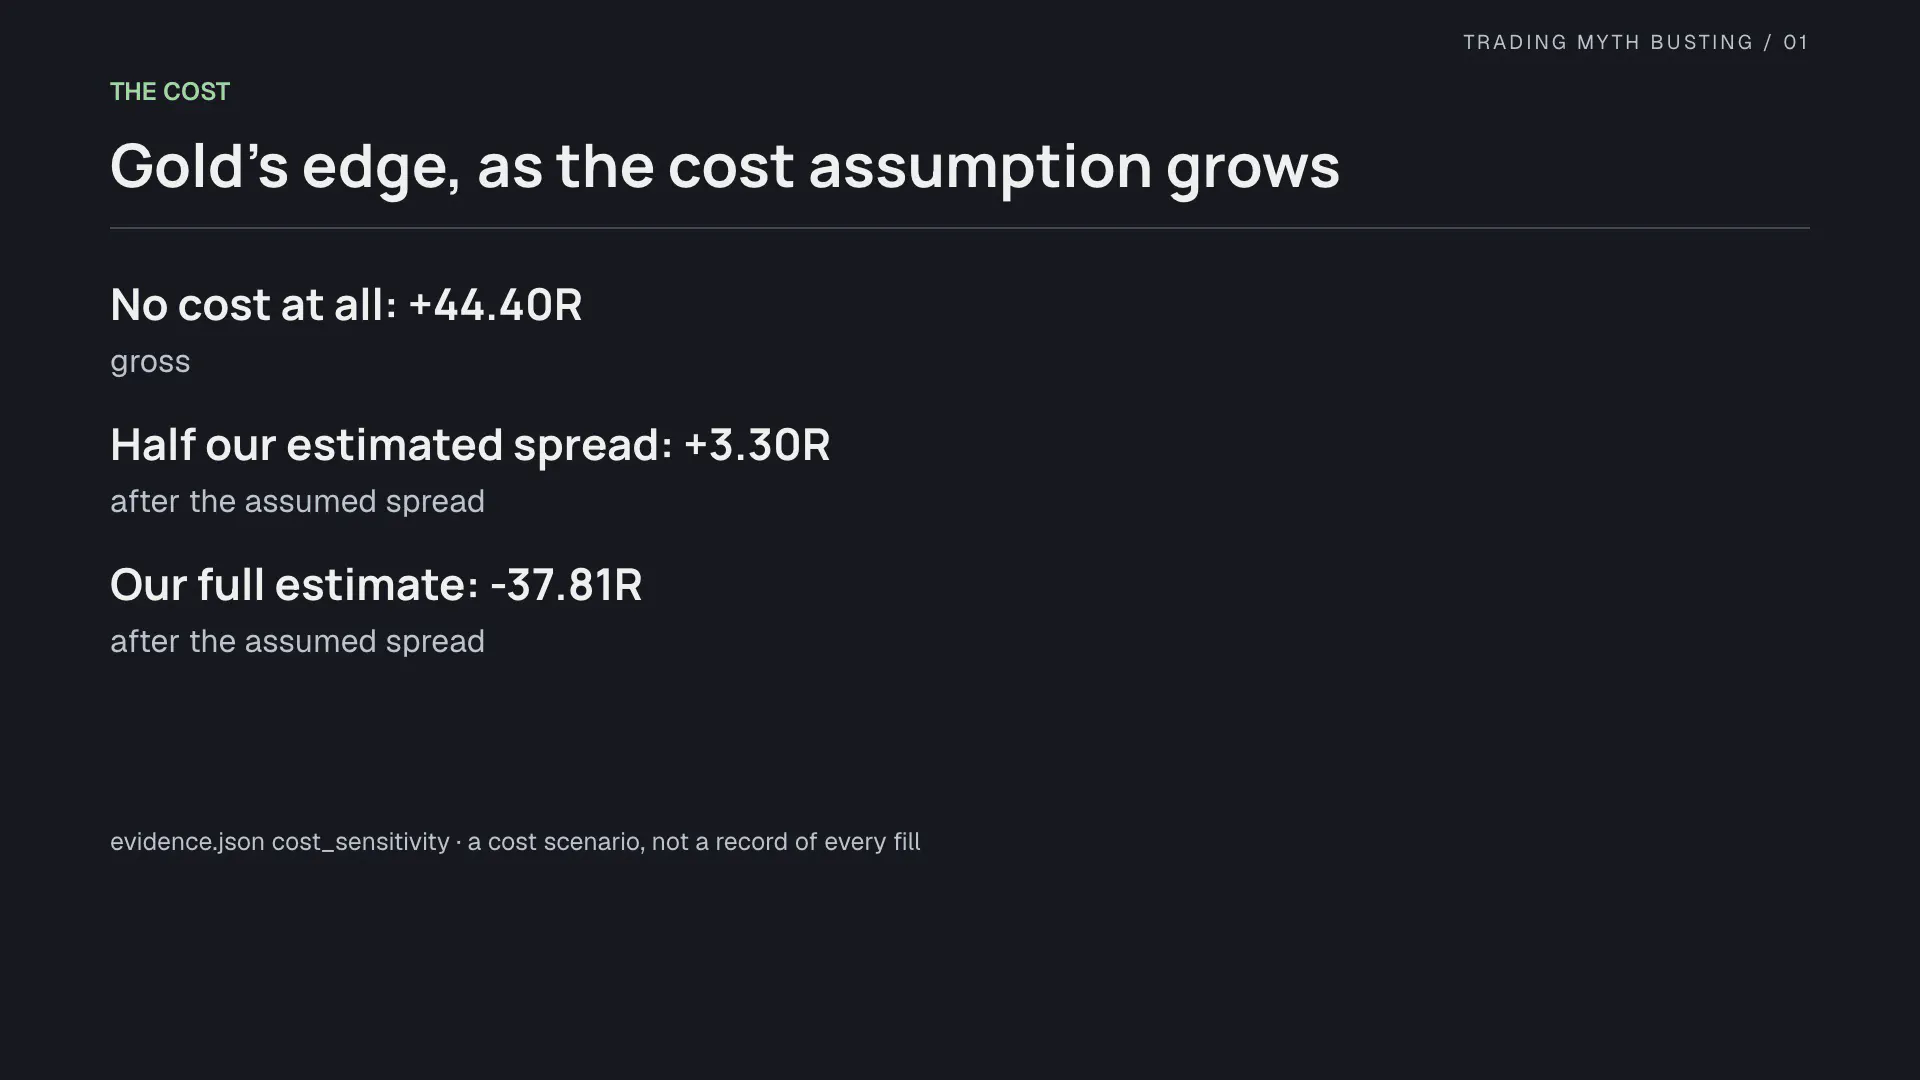
| 50% of the estimate | −342.21 | +3.30 | −113.82 |
| Full estimate | −632.43 | −37.81 | −189.41 |
| Twice the estimate | −1,212.86 | −120.01 | −340.60 |
At half of the estimated cost, gold retains +3.30 R; the gross gain disappears at about 54% of the estimate. The estimate is 0.06% per side on bitcoin and a static average Capital.com spread on gold and EUR/USD, without funding, swaps or slippage. That is a cost scenario, not a record of what every fill would have paid, but the conclusion does not depend on its precision: at the full estimate, gold needed a 36.05% hit rate and produced 34.82%, a shortfall of 1.23 percentage points.
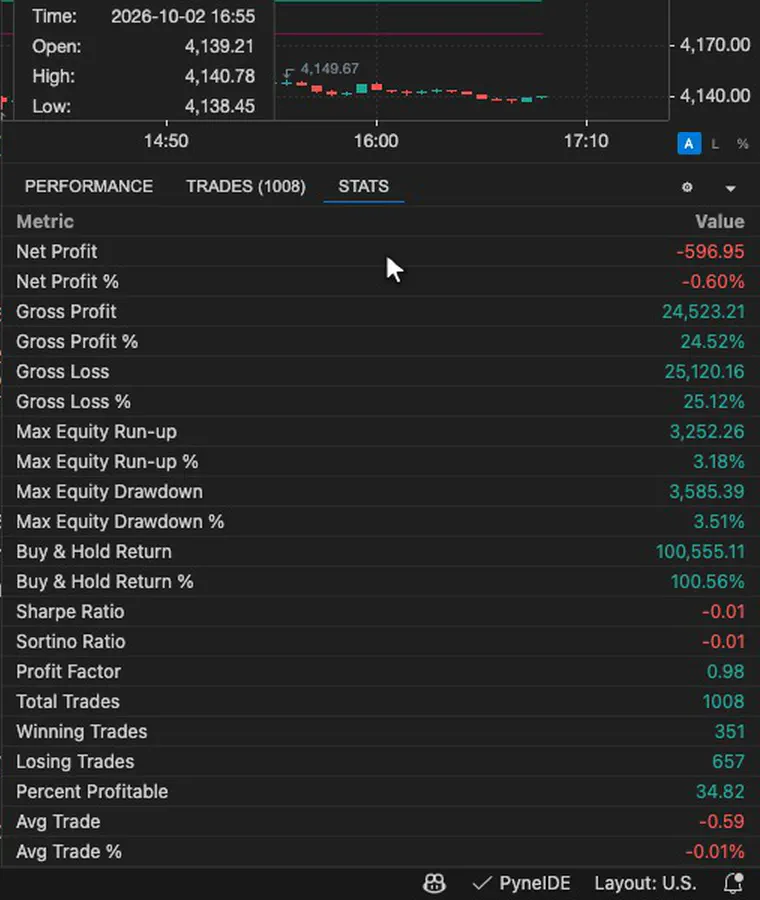
In the product, the same scenario is one Properties field: a commission of 0.19 per contract each way, the average gold spread per round trip. Net profit goes from +628.25 to −596.95 over the same 1,008 trades.
Why does position sizing not fix this? Risking 1% of the account per trade changes how much money each trade puts at risk. It does not change whether the expected result per unit of risk is negative, and after costs it is.
A profitable year inside a losing test
Gold’s baseline made money after estimated costs during 2025 and lost in 2024 and in the part of 2026 we have:
| Year | Trades | Hit rate | Gross R | After estimated cost R |
|---|---|---|---|---|
| 2024 | 358 | 34.4% | +11.00 | −35.95 |
| 2025 | 355 | 38.0% | +49.27 | +24.27 |
| 2026 (to Oct.) | 295 | 31.5% | −15.87 | −26.12 |
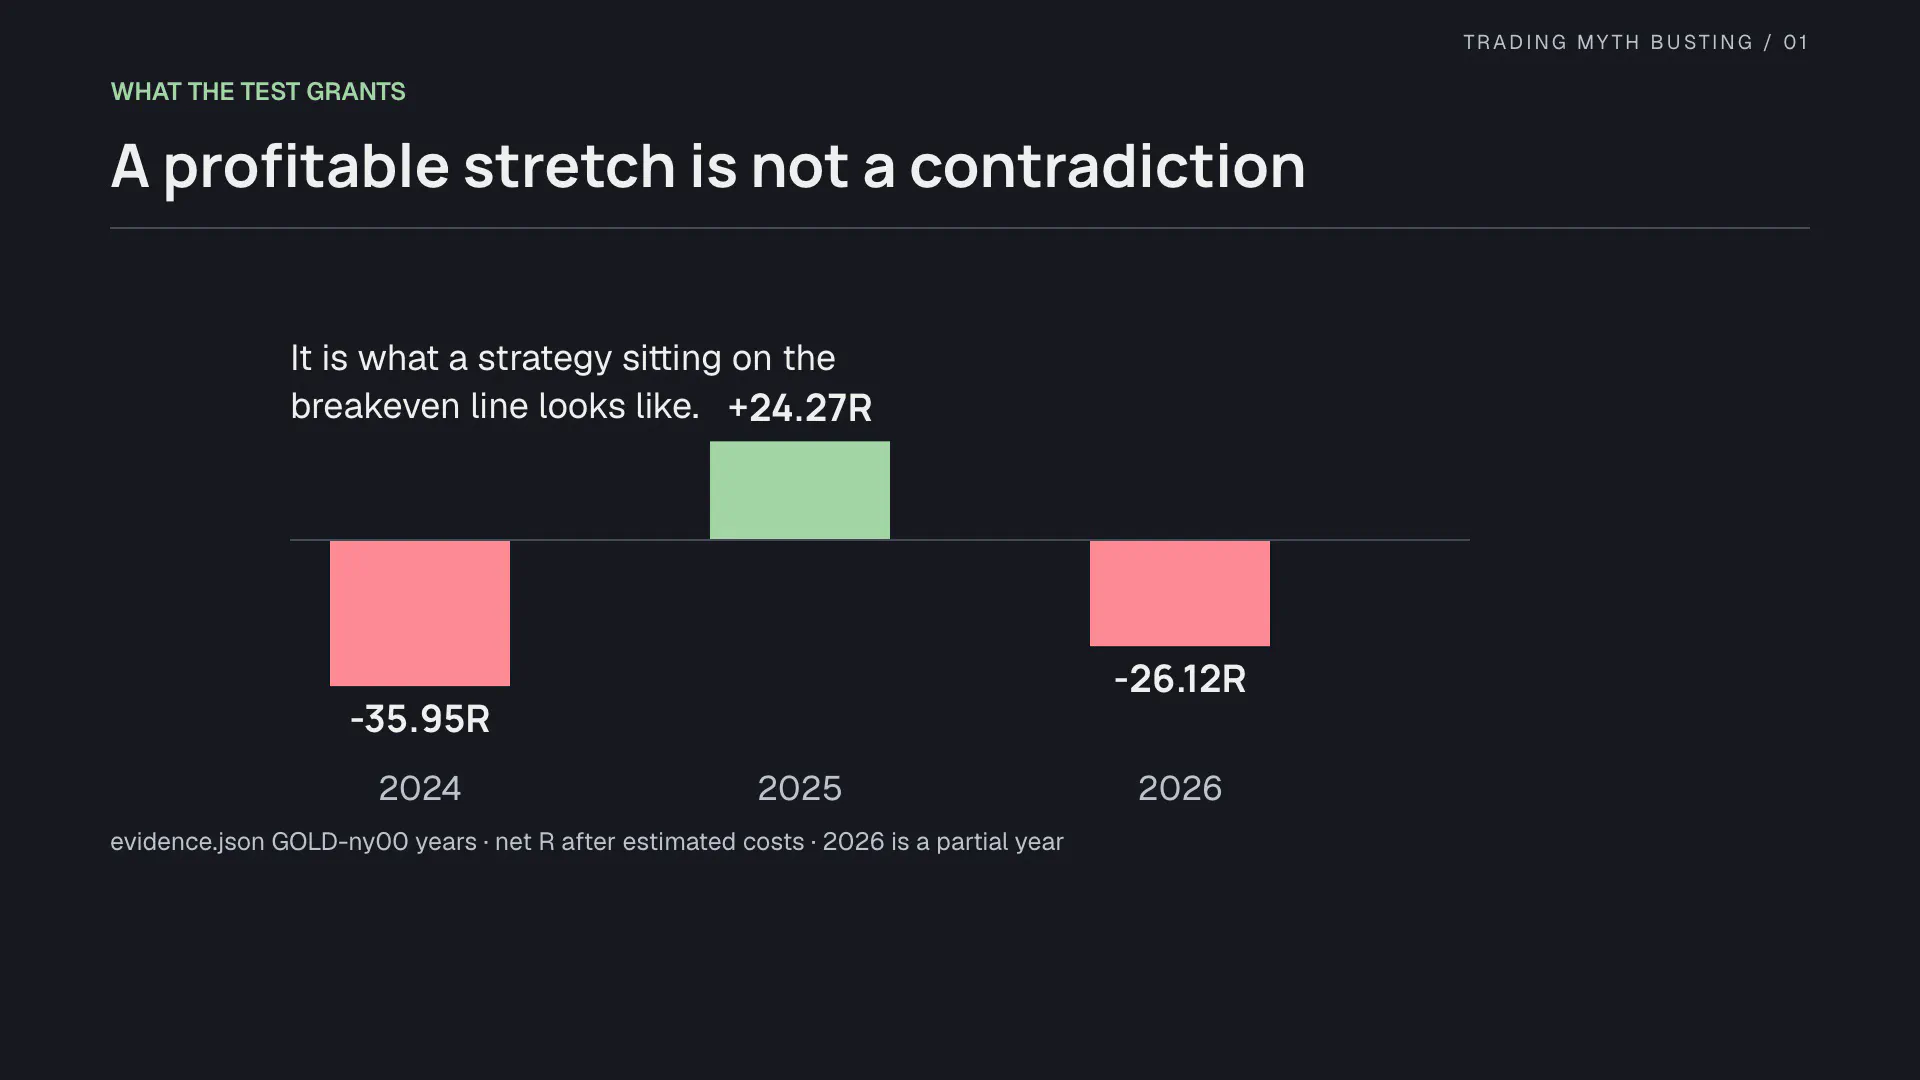
Somebody who traded this on gold through 2025 and reported that it works is telling the truth about their year. A profitable stretch inside a losing test is not a contradiction; it is what a strategy sitting on the breakeven line looks like. By month, gold was positive in 12 of 34 months after costs, EUR/USD in 5 of 34 and bitcoin in 3 of 45.
The video was published on August 29, 2025. From August 30 to the end of our data, after estimated costs, bitcoin made −191.95 R over 429 trades, gold −45.23 R over 401 and EUR/USD −94.69 R over 391.
Stop size
Does the trade work better when the breakout is small? Grouping gold’s baseline trades by stop distance in ATR:
| Stop distance | Trades | Hit rate | Gross R | After estimated cost R |
|---|---|---|---|---|
| Under 1 ATR | 112 | 37.5% | +14.00 | −13.74 |
| 1–2 ATR | 264 | 31.4% | −15.00 | −44.13 |
| 2–4 ATR | 307 | 36.2% | +25.55 | +8.46 |
| 4 ATR or more | 325 | 35.4% | +19.84 | +11.60 |
The smallest stops have the best hit rate and still lose after costs, because a cost is largest in R where the stop is tightest. There is no clean stop-size rule hidden in these groups, and picking the two positive buckets after seeing them would be fitting the result.
Ideas from the comments
We turned the concrete suggestions under the original video into 54 market, range and rule combinations: an EMA50 trend filter on the 5-minute, 15-minute or 1-hour chart, skipping the first hour of the New York session, allowing entries only after 10:00 New York, a target at the range midpoint, fixed gold stops at two readings of “100 pips”, 15-minute signals on gold, weekends off on bitcoin, and the range in UTC or from 09:00 instead of New York midnight.
Three of the 54 were positive over the full period after estimated costs, all on gold with the New York midnight range:
| Gold variant | Trades | Hit rate | Gross R | After estimated cost R |
|---|---|---|---|---|
| 5-minute EMA50 trend filter | 417 | 36.9% | +45.15 | +29.12 |
| 15-minute EMA50 trend filter | 294 | 37.4% | +36.13 | +21.15 |
| Entries from 10:00 New York only | 488 | 39.6% | +90.40 | +60.44 |
These are retrospective comparisons on the same data, with no untouched holdout and no correction for testing 54 combinations. For all three, the weekly block-bootstrap interval of the mean R after costs includes zero. Treat them as hypotheses to test on fresh data, not as fixes. None of the UTC or 09:00 range variants was positive after estimated costs.
What the test supports
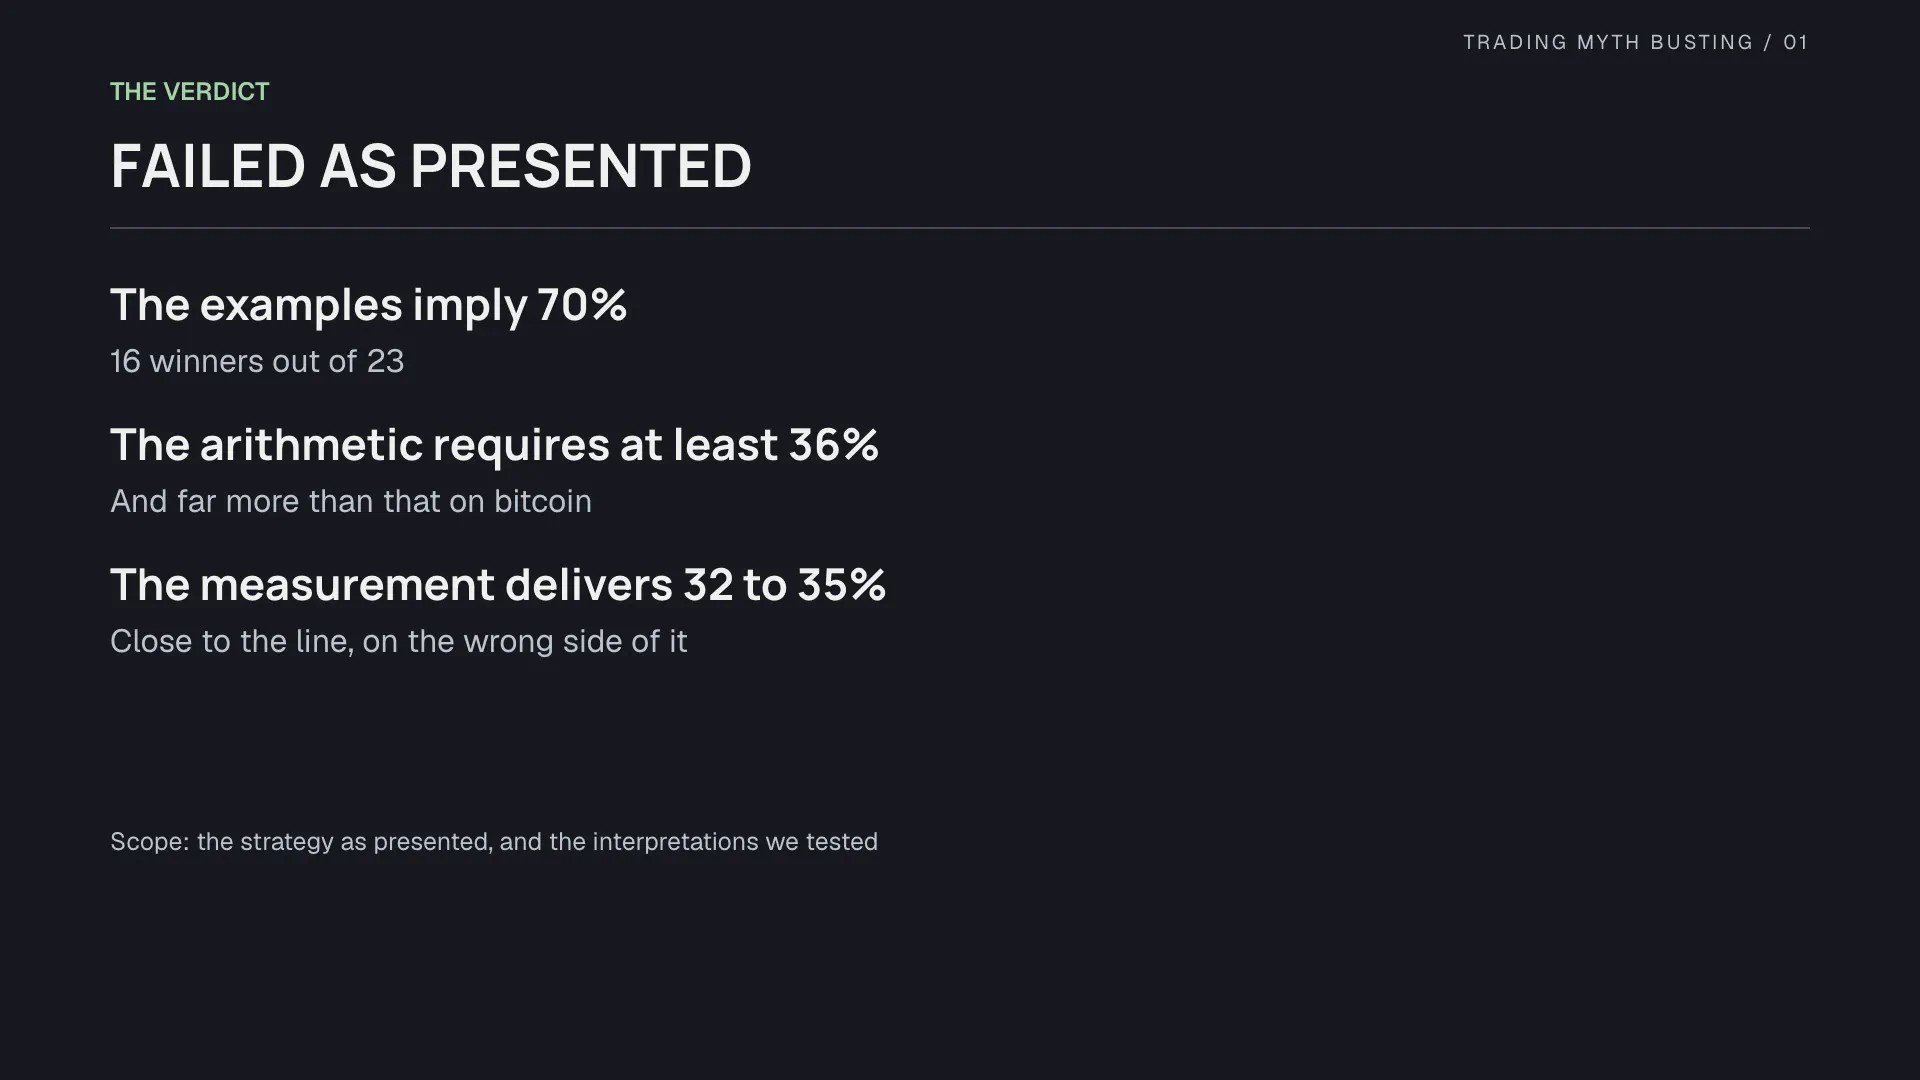
The 23 examples create the impression of a 70% strategy. The arithmetic requires at least 36%, and far more than that on bitcoin. The measurement delivers 32 to 35%. This strategy is not absurd. It is close. It is on the wrong side of the line, and the difference is paid out in fees.
We have not proved that no false-breakout strategy can work. We have shown that this one, as presented, does not clear its own costs, and that the single decision that might change that, the stop, is the one the video leaves inside the trader’s head.
Reproduce it
- The script: First 4-Hour Range False Breakout on TradingView. Match the data feed, date window and cost assumptions below to reproduce the research. The baseline defaults are: the New York 00:00-04:00 range, a 2R target and no stop filter. The comment-suggested variants are optional inputs, off by default. Pine source, MPL-2.0.
- The numbers: results-by-market.csv holds the baseline, the yearly and cost tables and the stop-size groups per market; comment-variants.csv lists all 54 comment combinations.
- The IDE in the video: PyneIDE, our IDE for Pine Script inside Visual Studio Code. It runs scripts locally on PyneCore, the open-source Pine runtime.
Data and assumptions. Bybit BTC/USDT perpetual futures from January 2023, Capital.com gold and EUR/USD bid quotes from January 2024, all ending in early October 2026, 5-minute candles. The range is New York 00:00–04:00; one position at a time; stop at the breakout extreme and target at 2R, both fixed at entry. R is the price result divided by the distance from the entry to the initial stop. Costs are an estimated scenario per market: 0.06% per side on bitcoin, Capital.com’s static average spread on gold and EUR/USD, no funding, swaps or slippage. Results are separate rule tests per market, not a portfolio return, and historical backtests do not guarantee future results. The video’s closer-stop rule is undefined, so our baseline keeps the stop at the extreme; that is our interpretation, not the creator’s exact system.
If you get a different result, include the symbol, dates, settings and costs so we can compare the experiments.