
Myth Busting · Episode 08
Break-Even Stop and 2 Targets on the "BEST MACD Trading Strategy", Tested: More Wins, Not More Money
TL;DR: In part 1, TradingLab’s “BEST MACD Trading Strategy [86% Win Rate]” won 38.1% of 1,140 trades on 5 years of Ethereum 15-minute candles, short of the 40% it needs to break even. Here we tried the 2 classic fixes on exactly the same entries. A break-even stop turned 166 trades into zeros and lowered the win rate to 32.8%. Half off at a first target raised it to 46.4%, but only 25.8% of trades reached both targets. Neither fix changed the result per trade measurably (6 of 6 paired tests), and none of the 9 versions, Trade Pro’s two readings of the strategy included, beat a coin flip that got the same fix. With 0.1% costs per round trip, all 9 lose. Script, every trade and every result are below.
Part 1 in one paragraph
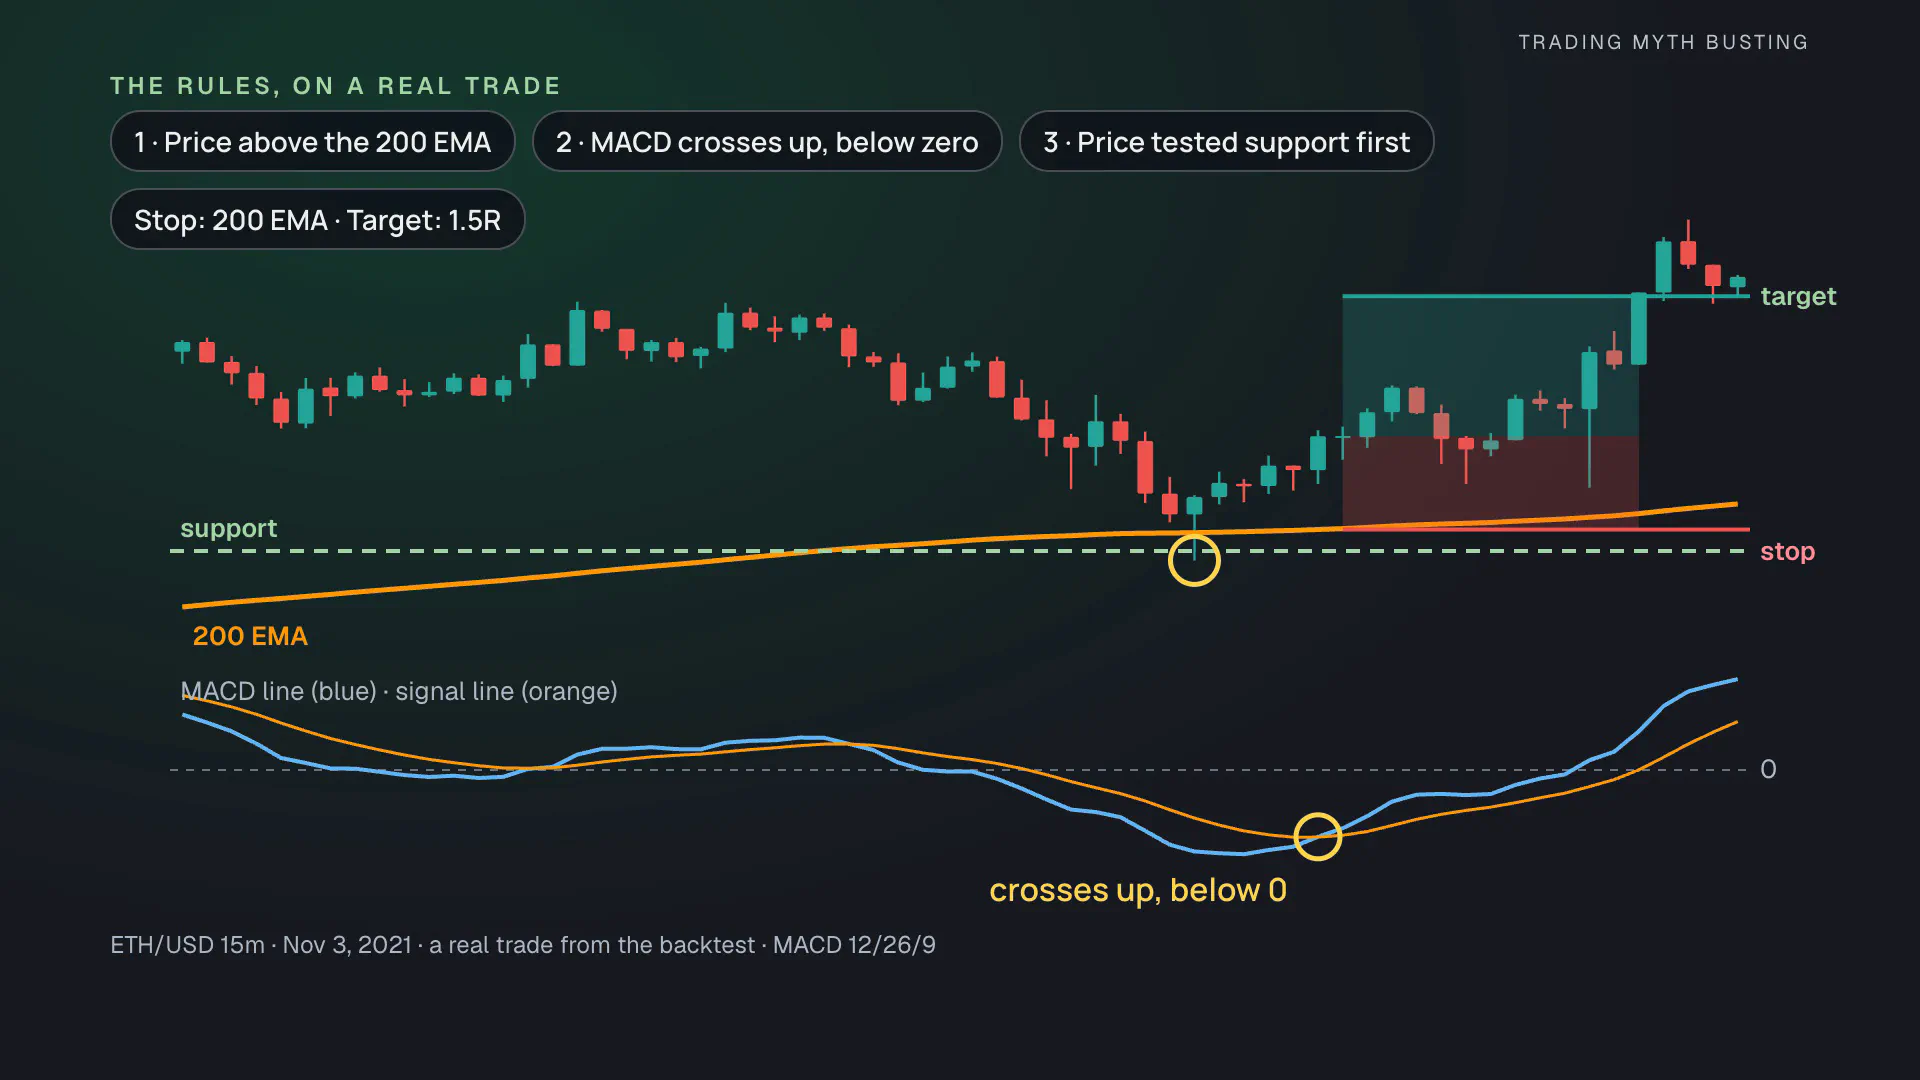
The strategy comes from TradingLab’s BEST MACD Trading Strategy [86% Win Rate] (October 3, 2021): longs above the 200 EMA when the MACD line crosses up below zero, after price has tested support; shorts mirrored. The stop goes at the 200 EMA, the target at 1.5 times the risk. In part 1 we coded the rules and ran them on Ethereum 15-minute candles from October 4, 2021 to October 31, 2026. With a 1.5R target the strategy needs 1 ÷ (1 + 1.5) = 40% to break even. It won 38%, lost money, and random directions on the same entries did better.
The 2 fixes, and where they come from
When a strategy like this loses, 2 pieces of advice come up again and again:
- Move the stop to break-even once the trade is up by its risk.
- Take half off at a first target, move the rest to break-even and let it run.
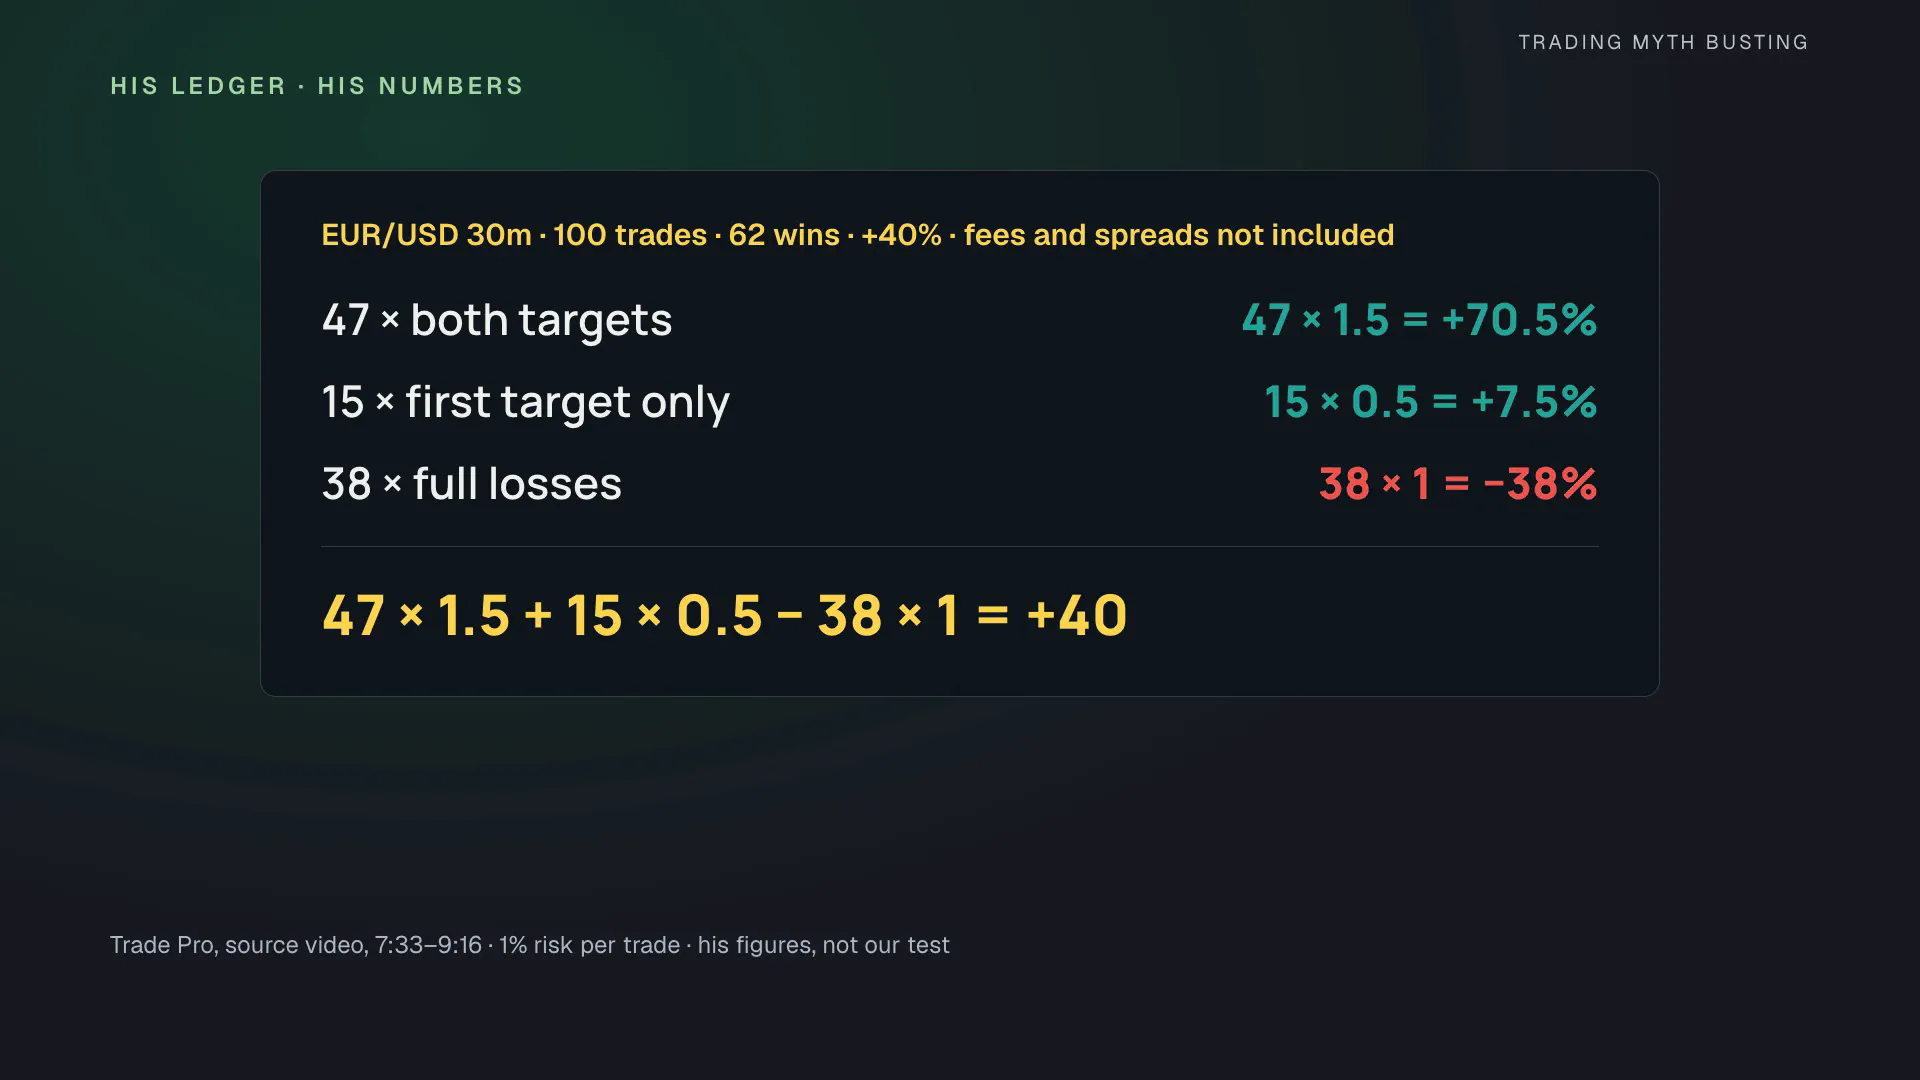
The second one has a clear source. Trade Pro, a channel that tests strategies 100 trades at a time, published Highly Profitable MACD Trading Strategy Proven 100 Trades (2 Stage Take Profit) on January 17, 2021. The scheme (2:14–2:58): close half at 1 times the risk, move the stop of the rest to the entry, target 2 times the risk. On EUR/USD 30-minute candles he reports 62 wins out of 100 and +40% at 1% risk per trade (7:33–8:08), and he recommends the approach: “you should be using a multiple take profit system” (10:26).
His math checks out, and he says himself that fees and spreads are not included: 47 trades reached both targets (+1.5% each), 15 only the first (+0.5%), 38 were full losses. 47 × 1.5 + 15 × 0.5 − 38 × 1 = +40. Note what counts as a win there: every trade that reached the first target, 62 in all, including the 15 that made half of 1R.
Trade Pro also tested the strategy from part 1, in “BEST MACD Trading Strategy [86% Win Rate]” Tested 100 Trades Full Results (October 10, 2024): 100 trades on BTC/USD 15-minute candles, 55 wins, +37.5%. He read the support rule differently, so we added his reading too, and the “classic MACD” version from his 2021 video, without a support filter and with an ATR stop.
Only the exit changes
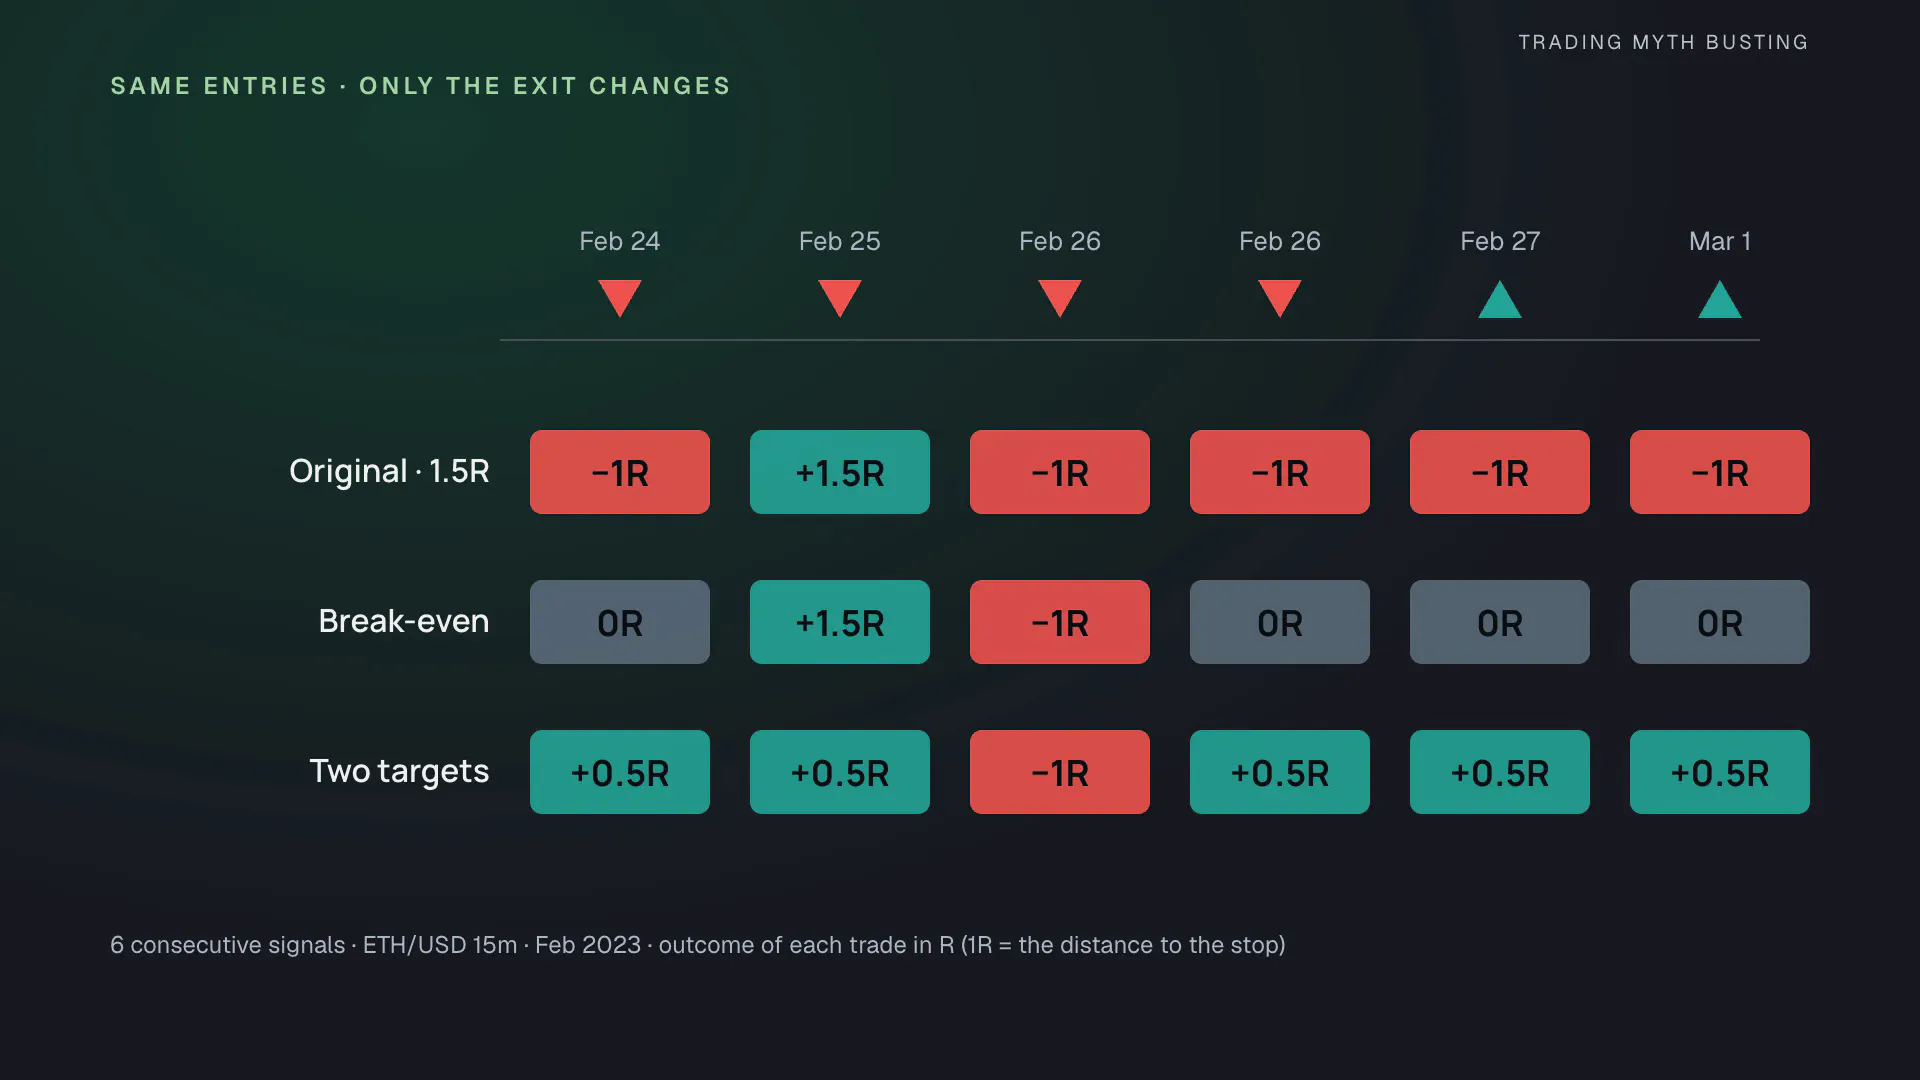
In this test the entries never change: same signals, same market, same 5 years. Only the exit does. So a difference comes from the fix, not from a luckier set of trades.
| Exit | Rule |
|---|---|
| Original (V0) | The whole position at 1.5R, stop unchanged |
| Break-even (V1) | Once a candle’s high reaches +1R (low for a short), the stop moves to the entry from the next candle on; target 1.5R |
| Two targets (V2) | Half at 1R; once that fills, the rest’s stop moves to the entry from the next candle on; the rest targets 2R |
R is the result divided by the distance from the actual entry to the stop fixed on the signal candle. A two-target trade books both halves: 0.5 × 1R + 0.5 × 2R = 1.5R when both targets fill.
Every result is checked against a coin. The coin takes the same entries, picks a random direction, and gets the same stop distance, the same targets and the same exit rule, mirrored to its side. If a fix only helps because of how it counts wins and losses, the coin gets that help too. 10,000 draws per version.
We registered the test plan on November 9, 2026, 09:21 UTC, before any break-even, two-target or alternative-reading run, and recorded its SHA-256 hash. An amendment the same morning, still before any run, added Trade Pro’s two readings and a stricter bar for 9 versions. A second amendment on November 13 followed the reproduction check (part 1’s trade list came back exactly) and came before any new result was seen. Because 9 versions get 9 chances, a version has to beat 99.44% of its coin draws, not 95%, to count as an edge.
One detail differs from part 1: the plan takes no new entry on the candle a trade closed on, as the corrected script in part 1 does. That makes the original exit 1,140 trades, 38.1% (95% interval 35.3–40.9%) and −55.0R, instead of part 1’s 1,146 trades and −58.5R.
Fix 1: the break-even stop
The promise: once the trade is up by its risk, it can’t lose.
It works on some trades. 554 of the original trades reached +1R, and 120 of them still ended at −1R. With the break-even stop, 23 of those remain (on the trigger candle itself the original stop is still live). But it also cuts trades that would have won: price touches +1R, dips back to the entry, then runs to the target. With the fix the trade is already out, at 0.
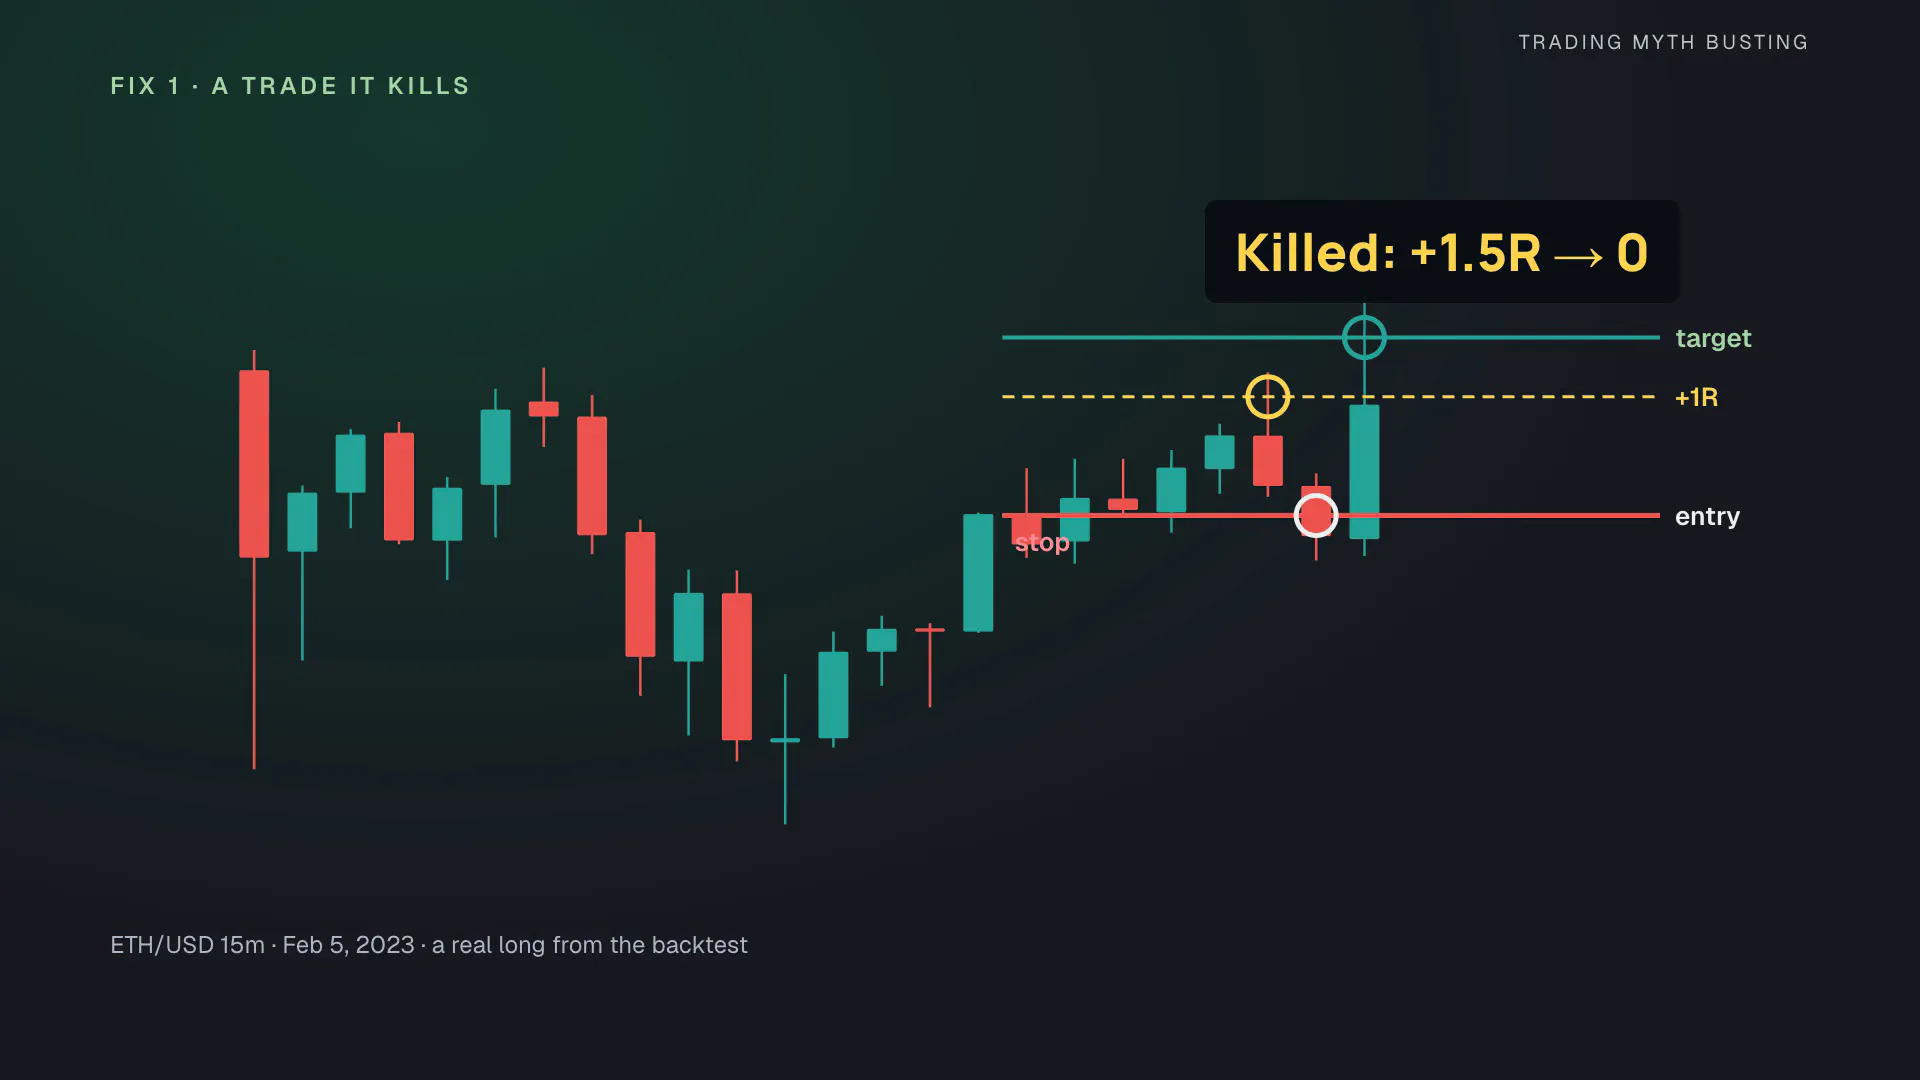
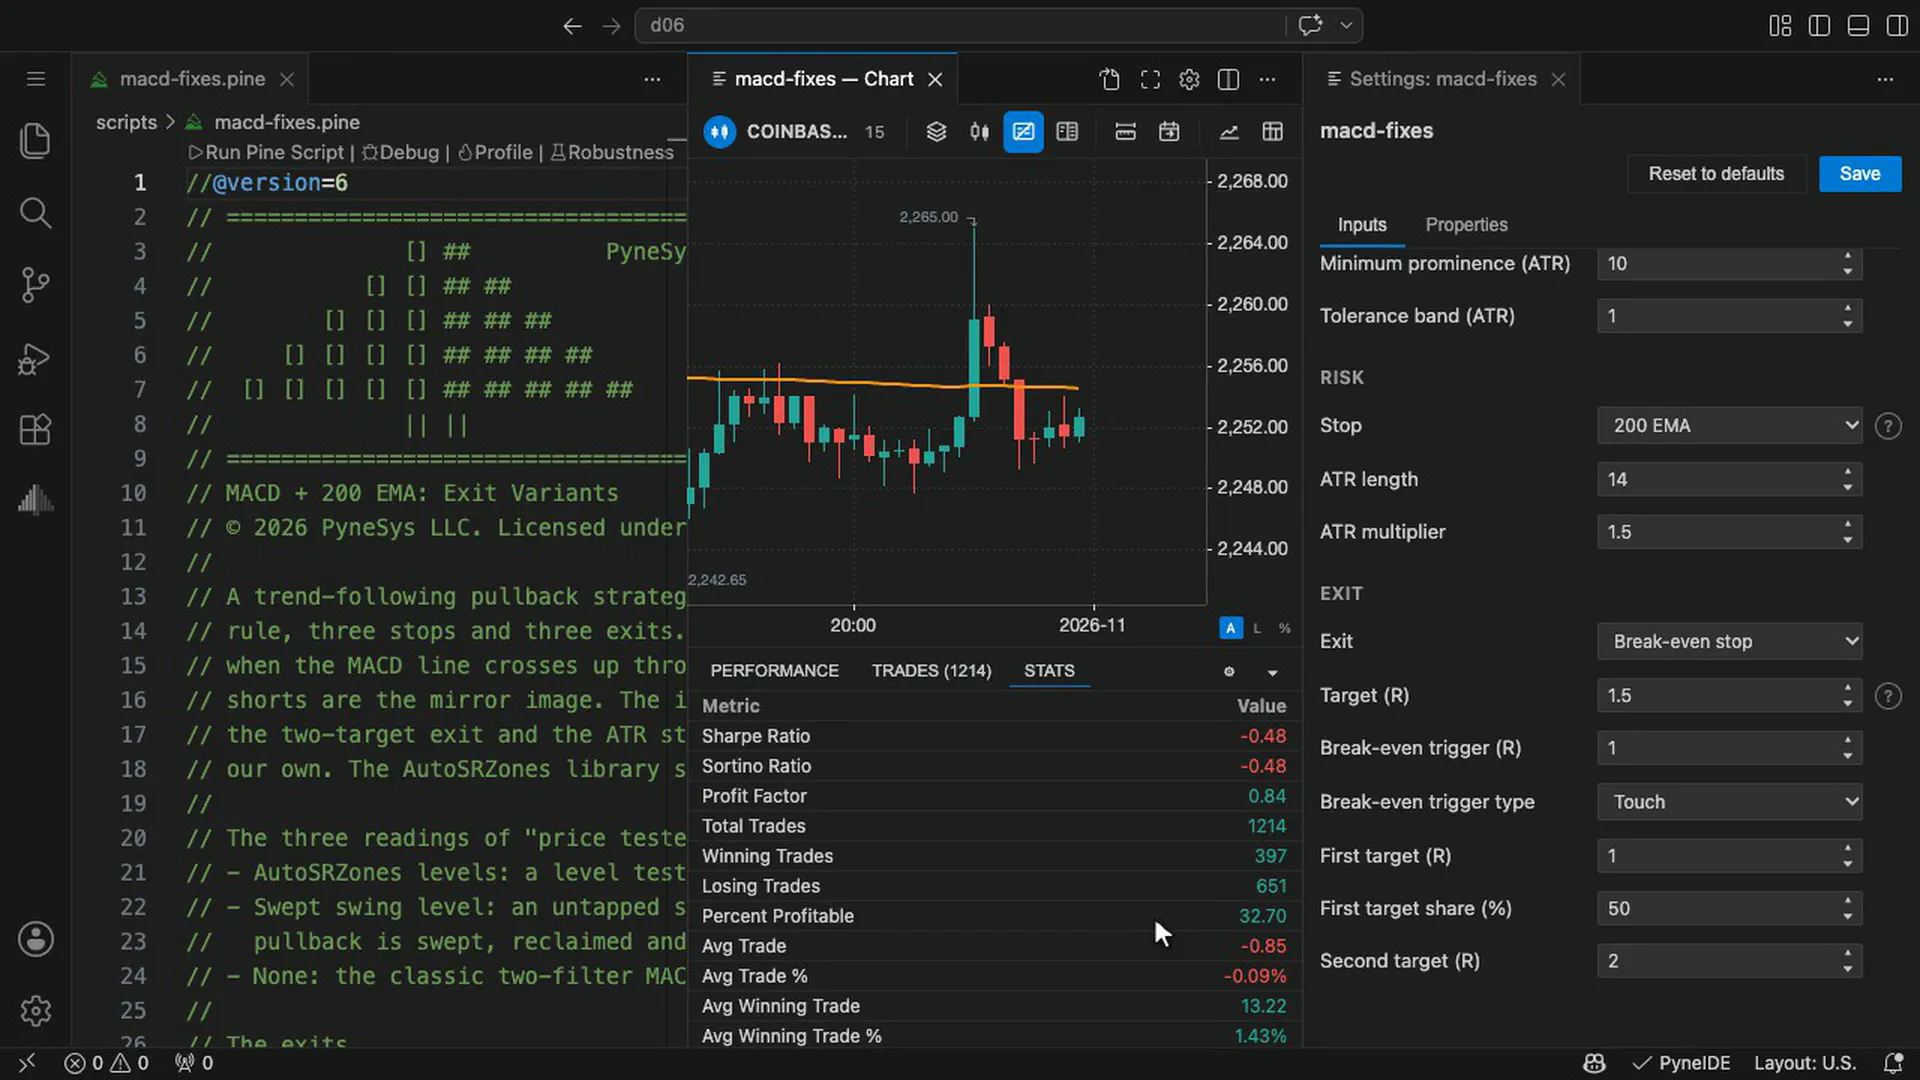
In the script it is a few lines: once a candle’s high reaches the trigger, the stop moves to the entry price, effective from the next candle.
// Break-even stop: the bar touched (or closed beyond) the trigger level.
if exitMode == "Break-even stop" and strategy.position_size != 0 and not fillRun and not stopMoved and riskPerUnit > 0
    float trigger = entryPrice + side * breakEvenTrigger * riskPerUnit
    float probe = breakEvenTriggerType == "Touch" ? (isLong ? high : low) : close
    if side * (probe - trigger) >= 0
        stopMoved := true
        strategy.exit(entryId + " exit", entryId, limit=entryPrice + side * rewardRatio * riskPerUnit, stop=entryPrice)
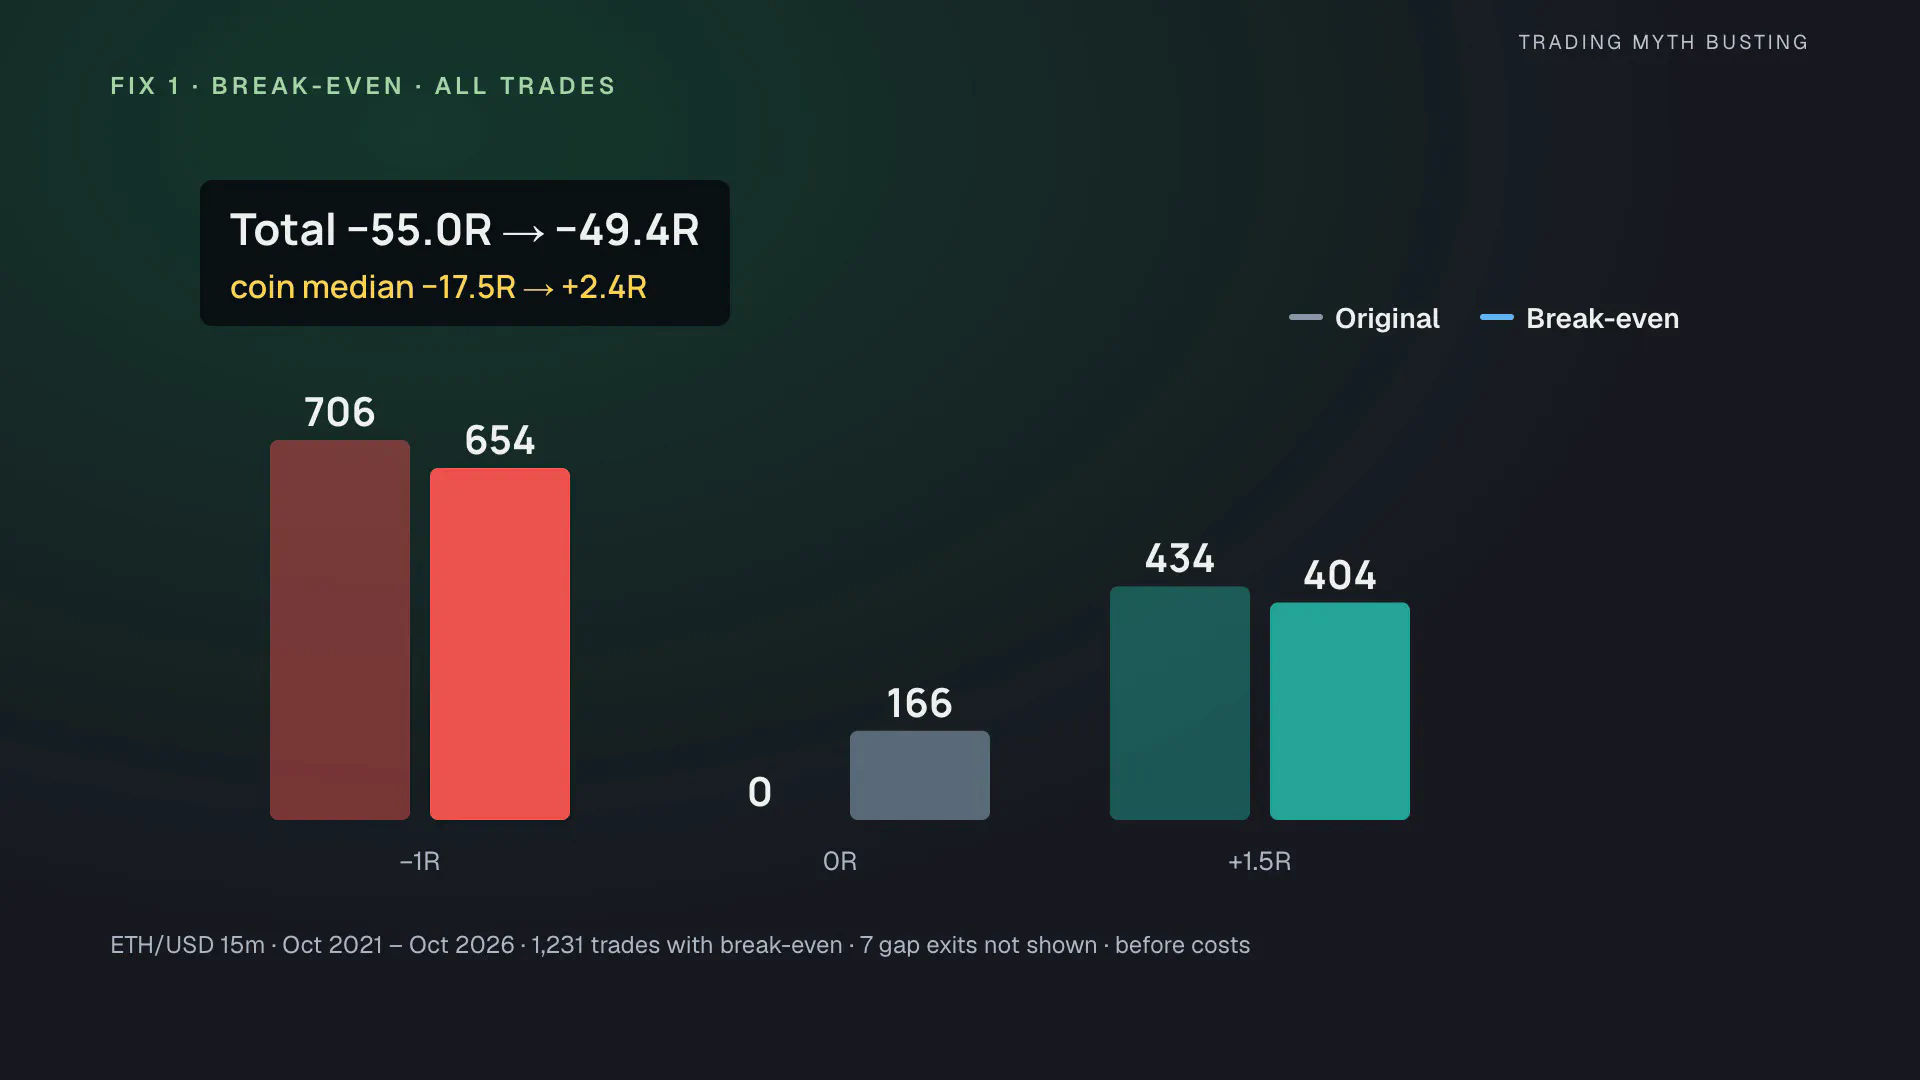
On all 1,231 trades the break-even exit took:
- 166 trades ended at 0R;
- full losses fell from 706 to 654, but full wins fell from 434 to 404;
- the win rate dropped from 38.1% to 32.8%;
- the total moved from −55.0R to −49.4R.
The coin with the same break-even stop moved from a median of −17.5R to +2.4R. It improved more than the strategy did, and the strategy’s percentile among the coin draws fell from the 15th to the 8th. On the same 1,140 entries, the break-even exit changed the average trade by +0.011R (95% interval −0.017 to +0.039R): NO MEASURABLE CHANGE.
Fix 2: two targets
In the script, the two-target exit is 2 exit orders. The first takes half at 1R. Once it has filled, the second one’s stop moves to the entry.
// Two targets: the first target has filled, so the rest moves to break-even.
if twoTargets and strategy.position_size != 0 and not fillRun and not stopMoved and riskPerUnit > 0 and firstTargetFilled
    stopMoved := true
    strategy.exit(entryId + " TP2", entryId, limit=entryPrice + side * secondTarget * riskPerUnit, stop=entryPrice)
Counted Trade Pro’s way, the win rate jumps from 38.1% to 46.4% (95% interval 43.6–49.2%). Look at what counts as a win: take half at 1R, get stopped at the entry with the rest, and that is a win worth half of 1R. 238 of 1,209 trades ended that way. Only 25.8%, about 1 trade in 4, reached both targets. 22 ended at 0, 626 were full losses.
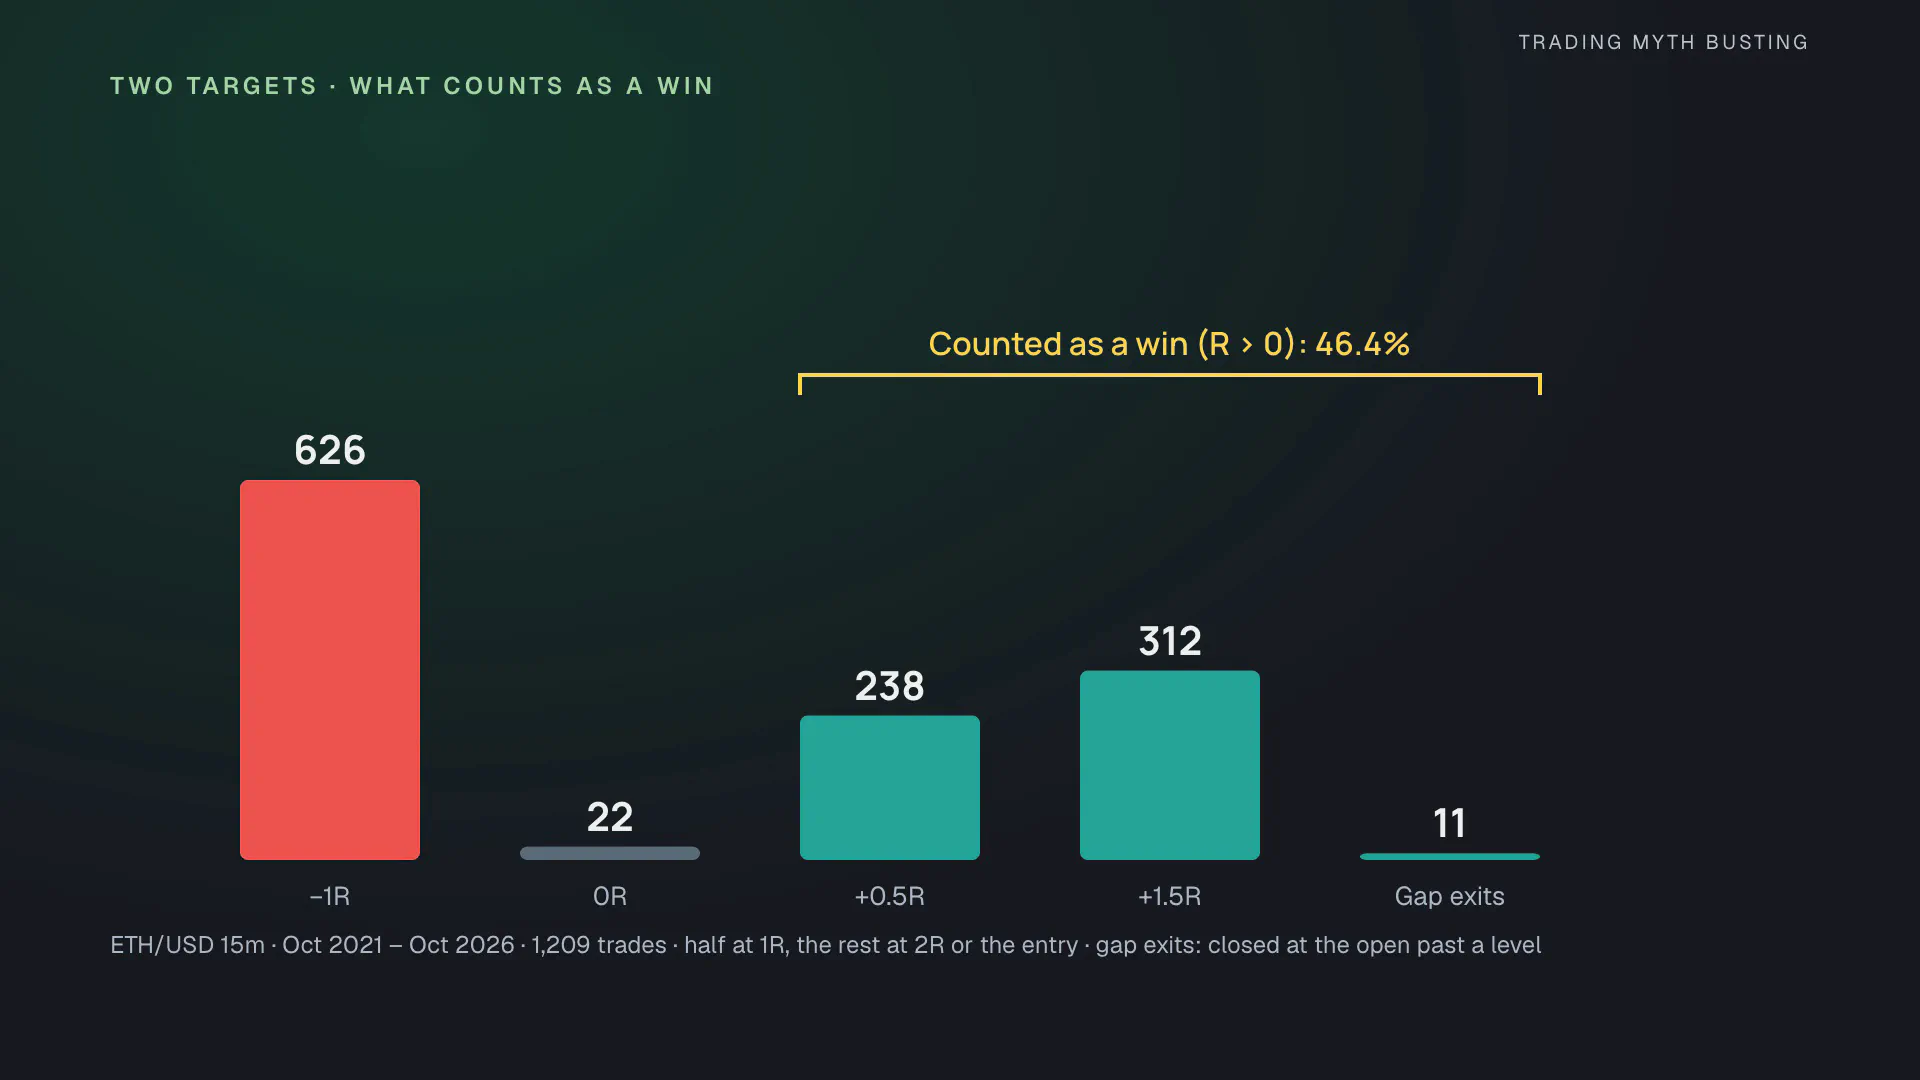
The total improved to −34.9R, still a loss. And the coin with the same two targets moved to a median of +4.6R; the strategy stayed at the 13th percentile of its draws. On the same 1,140 entries, the two-target exit changed the average trade by +0.027R (95% interval −0.008 to +0.061R): NO MEASURABLE CHANGE.
We gave it $1,000
To make it visible we gave each version a simulated $1,000 account: 1% of equity risked per trade, the position never larger than the account (no leverage), before costs. The original exit ended at $596 and the two-target exit at $695, better, but still a loss. Then we gave the coin the same two targets. Its median draw, of 2,000, ended at $928, and 86.6% of the draws finished ahead of the strategy.
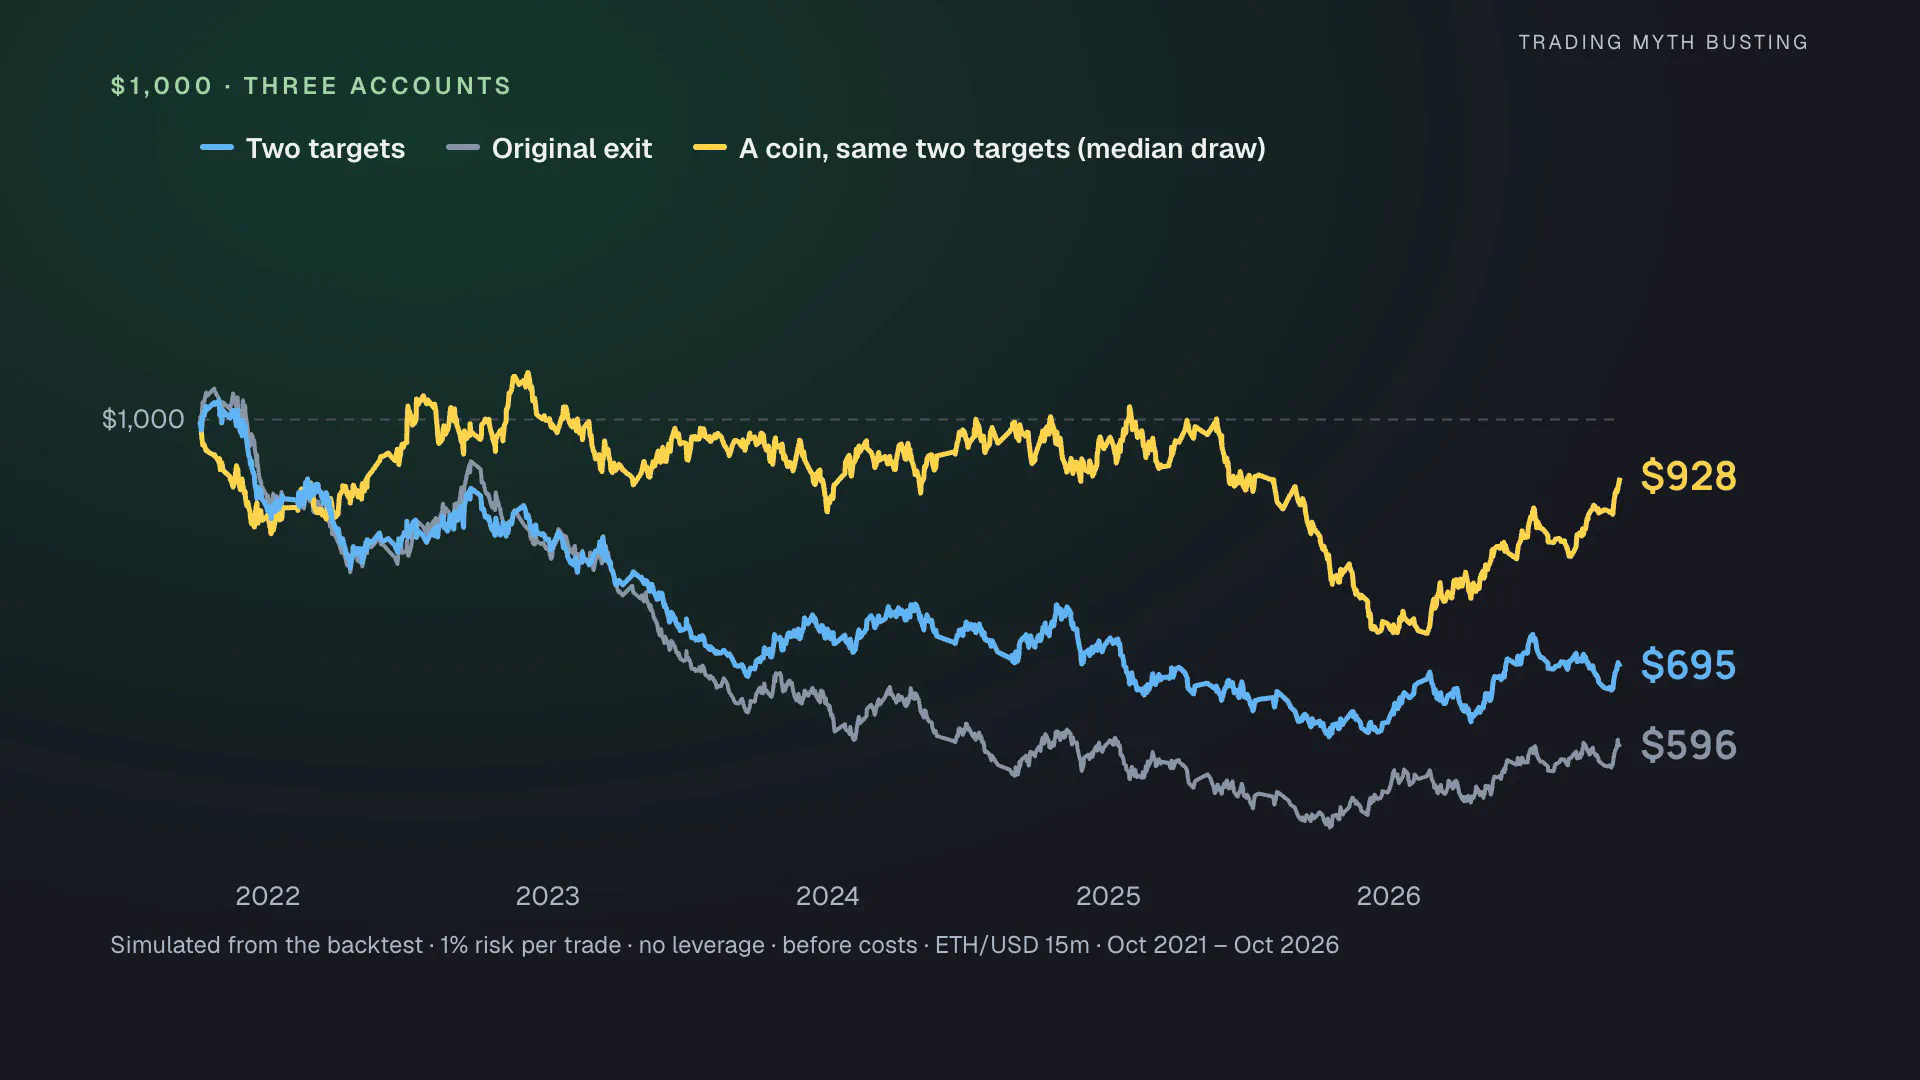
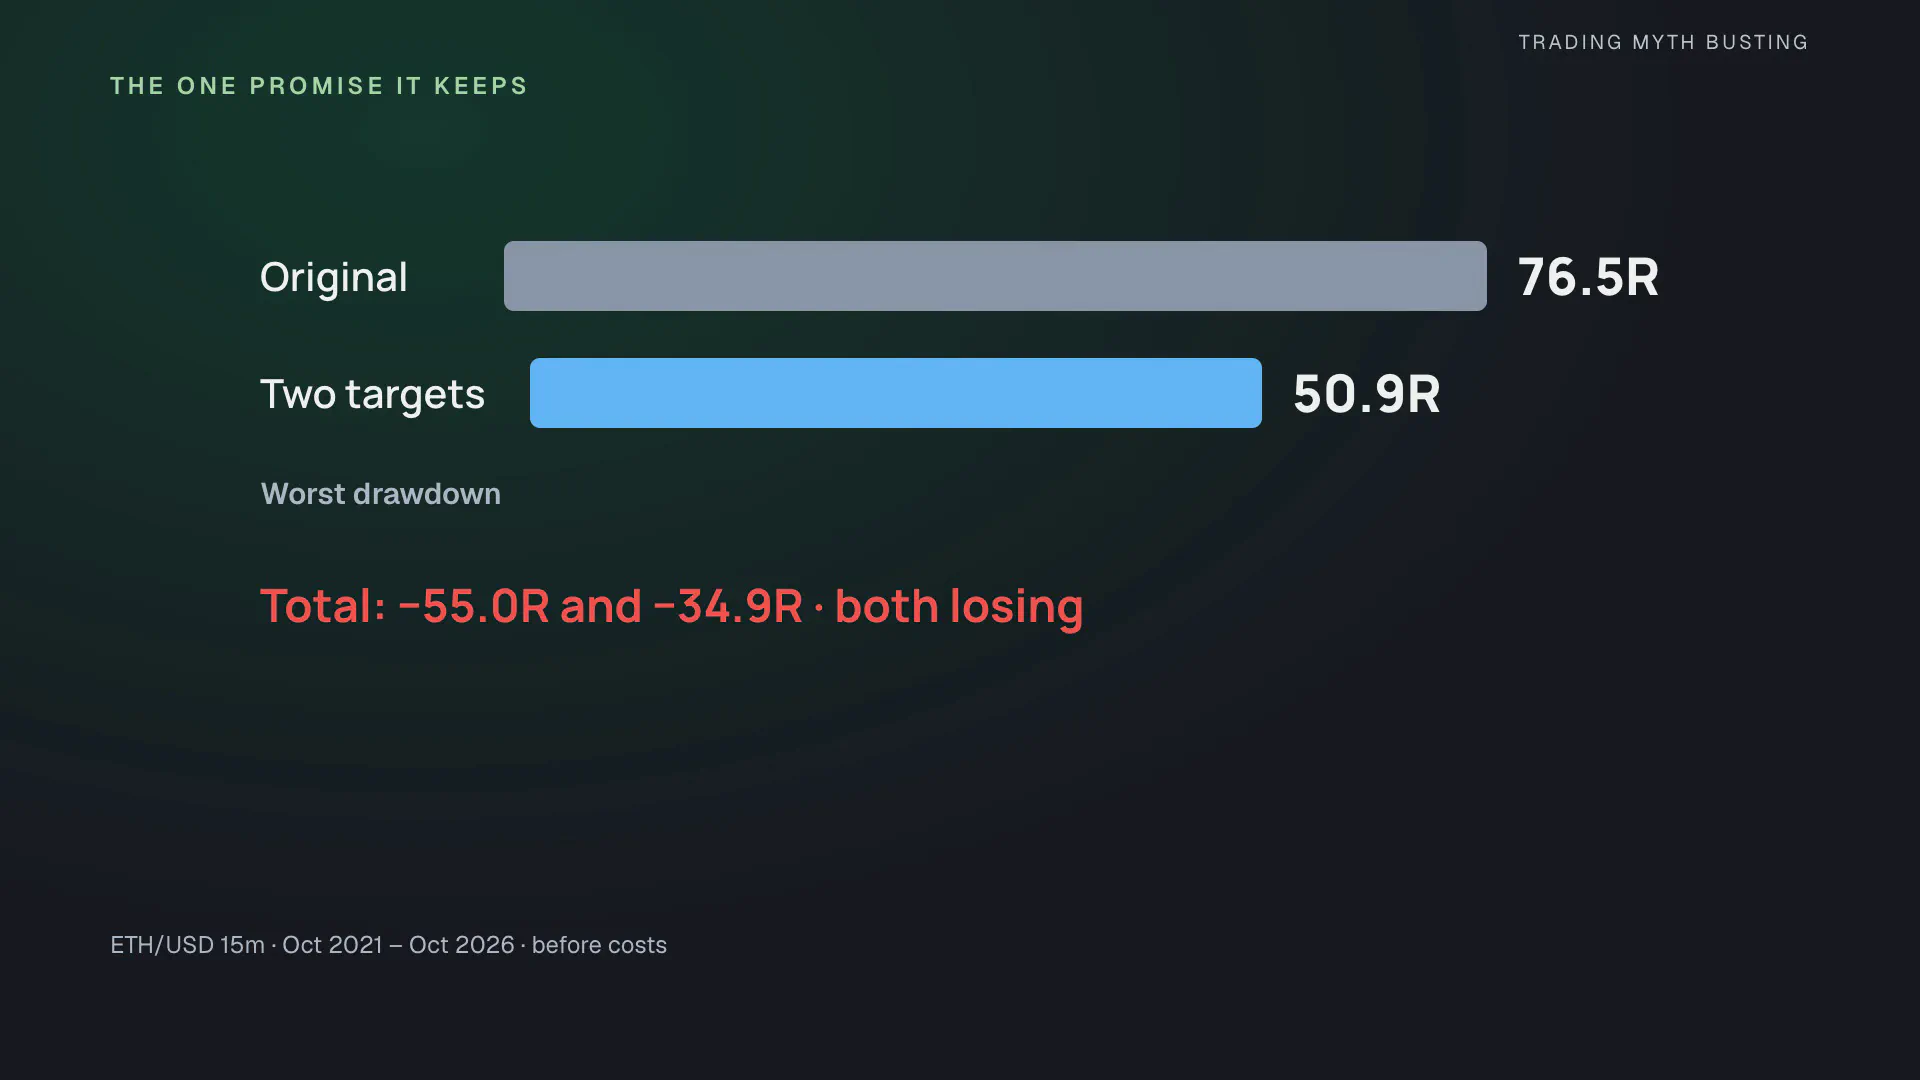
To be fair, the two-target exit keeps one of Trade Pro’s promises. The worst drawdown is smaller: 50.9R instead of 76.5R (41% of the account instead of 52%). That is a measured, descriptive result. But a smaller drawdown on a losing strategy is still a losing strategy.
His reading of the support rule
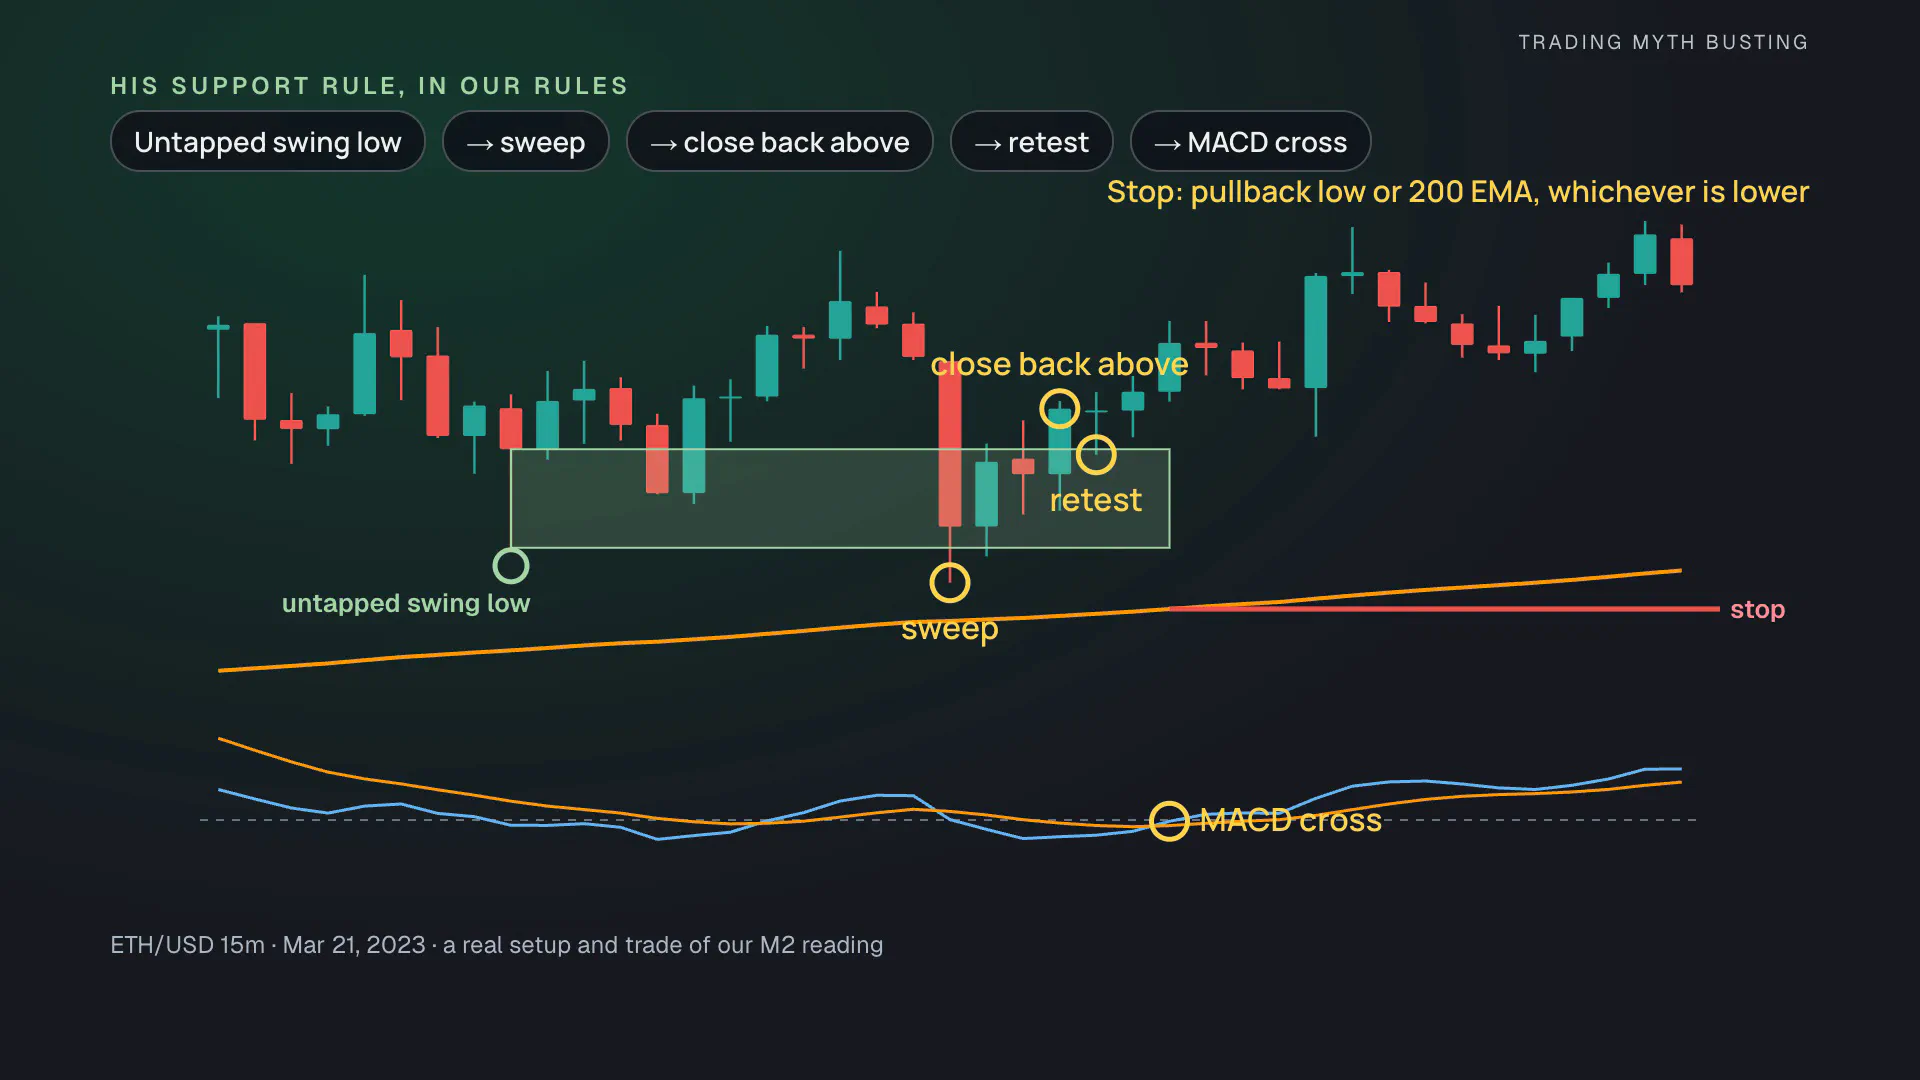
Trade Pro’s 2024 test of the same strategy got 55% and made money. He read the support rule differently (4:23–7:17): not just any level, but a short-term swing low that price hasn’t touched since it formed. Price sweeps below it, closes back above it, comes back to test it, and only then comes the MACD cross. The stop goes at the pullback’s low, or at the 200 EMA.
He marks those swing lows with his own market-structure indicator, and its code isn’t public. So we turned his description into fixed rules, one step at a time:
- a swing low is a candle whose low is below the lows on both sides, known one candle later, untapped until price trades below it;
- after the latest swing high, the untapped swing lows from before it are the candidate supports, each covering its candle’s wick from the low up to the body;
- a sweep trades below the zone, a close above the body reclaims it, a later candle dips back into the zone (the retest), then the MACD cross gives the signal; a close below the zone cancels it;
- the stop goes at the lower of the pullback’s low and the 200 EMA, because “near the EMA” is a judgment call.
His older “classic MACD” version drops the support filter and puts the stop 1.5 ATR below the signal candle’s low (the formula of a public port of the trailing ATR stop indicator he uses, here set once on the signal candle).
3 readings, 3 exits, 9 versions:
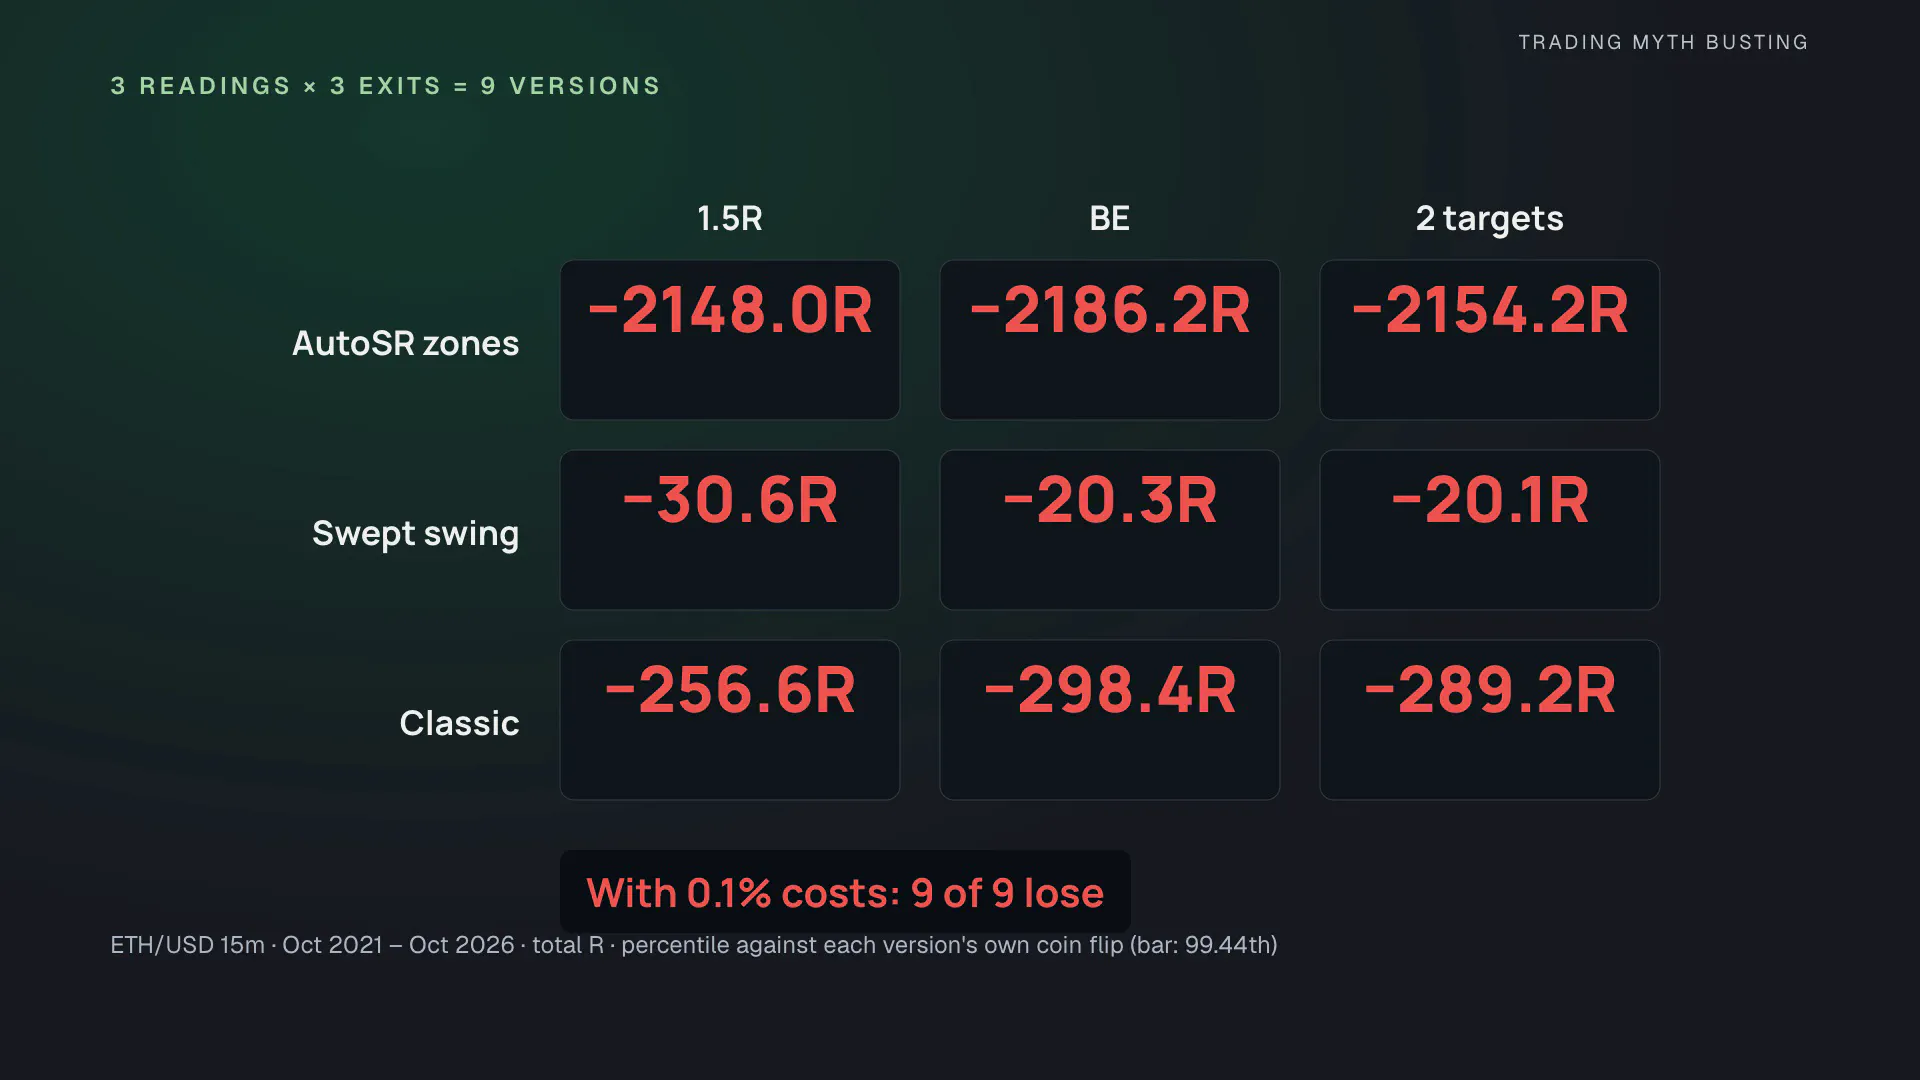
| Reading, exit | Trades | Win rate (R > 0) | Total R, before costs | At 0.1% costs | Coin-flip percentile |
|---|---|---|---|---|---|
| Part 1’s reading, original | 1,140 | 38.1% | −55.0 | −2,148 | 14.8 |
| Part 1’s reading, break-even | 1,231 | 32.8% | −49.4 | −2,186 | 8.4 |
| Part 1’s reading, two targets | 1,209 | 46.4% | −34.9 | −2,154 | 13.3 |
| Swept swing level, original | 229 | 39.7% | −1.5 | −31 | 55.4 |
| Swept swing level, break-even | 233 | 33.9% | +9.3 | −20 | 73.3 |
| Swept swing level, two targets | 231 | 53.2% | +9.4 | −20 | 76.5 |
| Classic MACD, ATR stop, original | 2,040 | 40.4% | +20.0 | −257 | 30.4 |
| Classic MACD, ATR stop, break-even | 2,180 | 33.7% | +0.6 | −298 | 25.5 |
| Classic MACD, ATR stop, two targets | 2,142 | 49.5% | +1.9 | −289 | 30.7 |
5 of the 9 finish ahead before costs. Not one reaches the 95th percentile of its coin draws, let alone the 99.44th. With 0.1% per round trip, all 9 lose. Costs hit part 1’s reading hardest because its stop at the EMA is often very close to the entry: the median risk is 0.70% of the price, so a 0.1% cost is a large slice of every trade’s risk.
None of the 6 paired comparisons (break-even and two targets against the original exit, on the same entries, for each reading) shows a measurable change. The largest effect, +0.06R per trade on the swept-swing reading, rests on 229 trades and cannot be told apart from zero.
Why two honest tests disagree
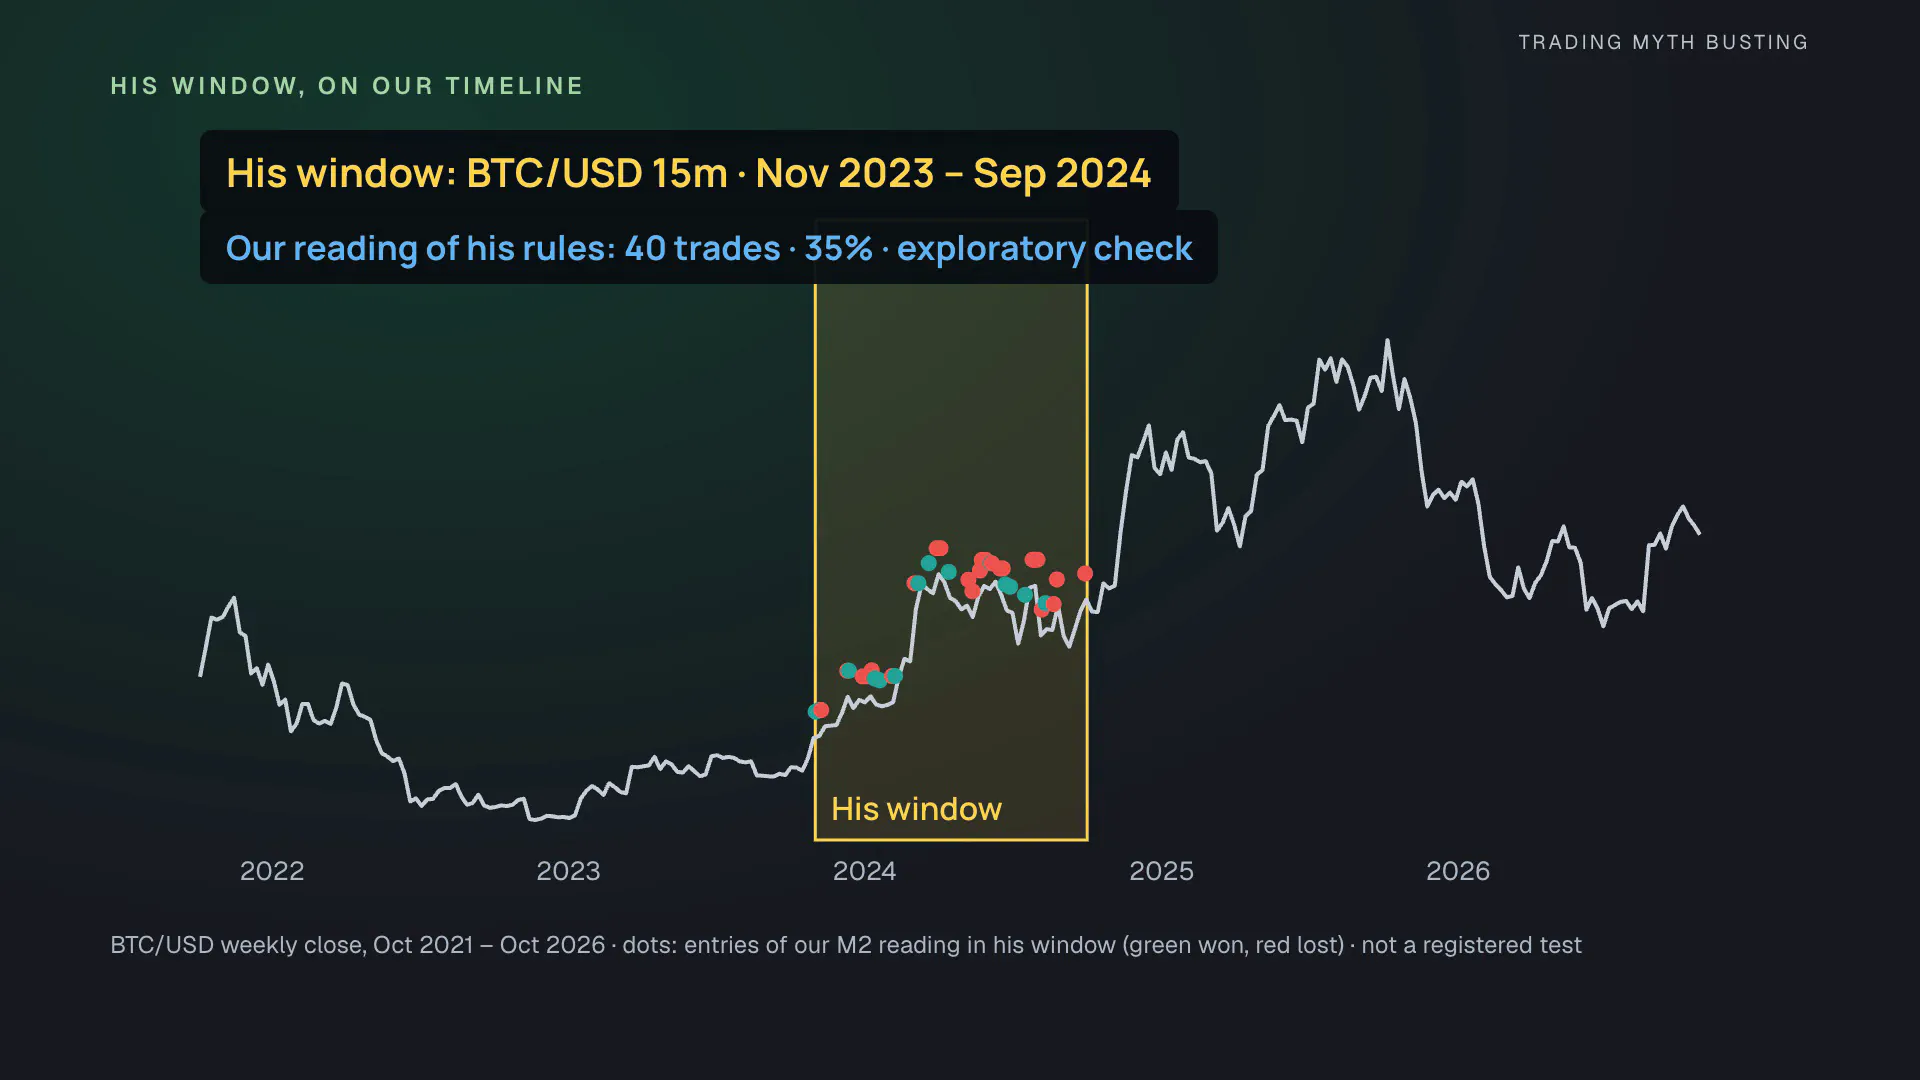
So why did his test make money? He used 11 months of bitcoin on 15-minute candles. His exact dates aren’t given, so we ran our version of his reading on the 11 months before his video, November 2023 to September 2024. It found 40 trades, not 100, and won 35.0% (95% interval 22.1–50.5%), −5.0R. That is an exploratory check, not a registered test: his reading has judgment calls our rules can’t copy, so this is our test of his idea, not a rerun of his test.
And 100 trades is a small sample. At 55 wins out of 100, the 95% range runs from about 45% to 64% (Wilson interval). Two honest tests can land far apart.
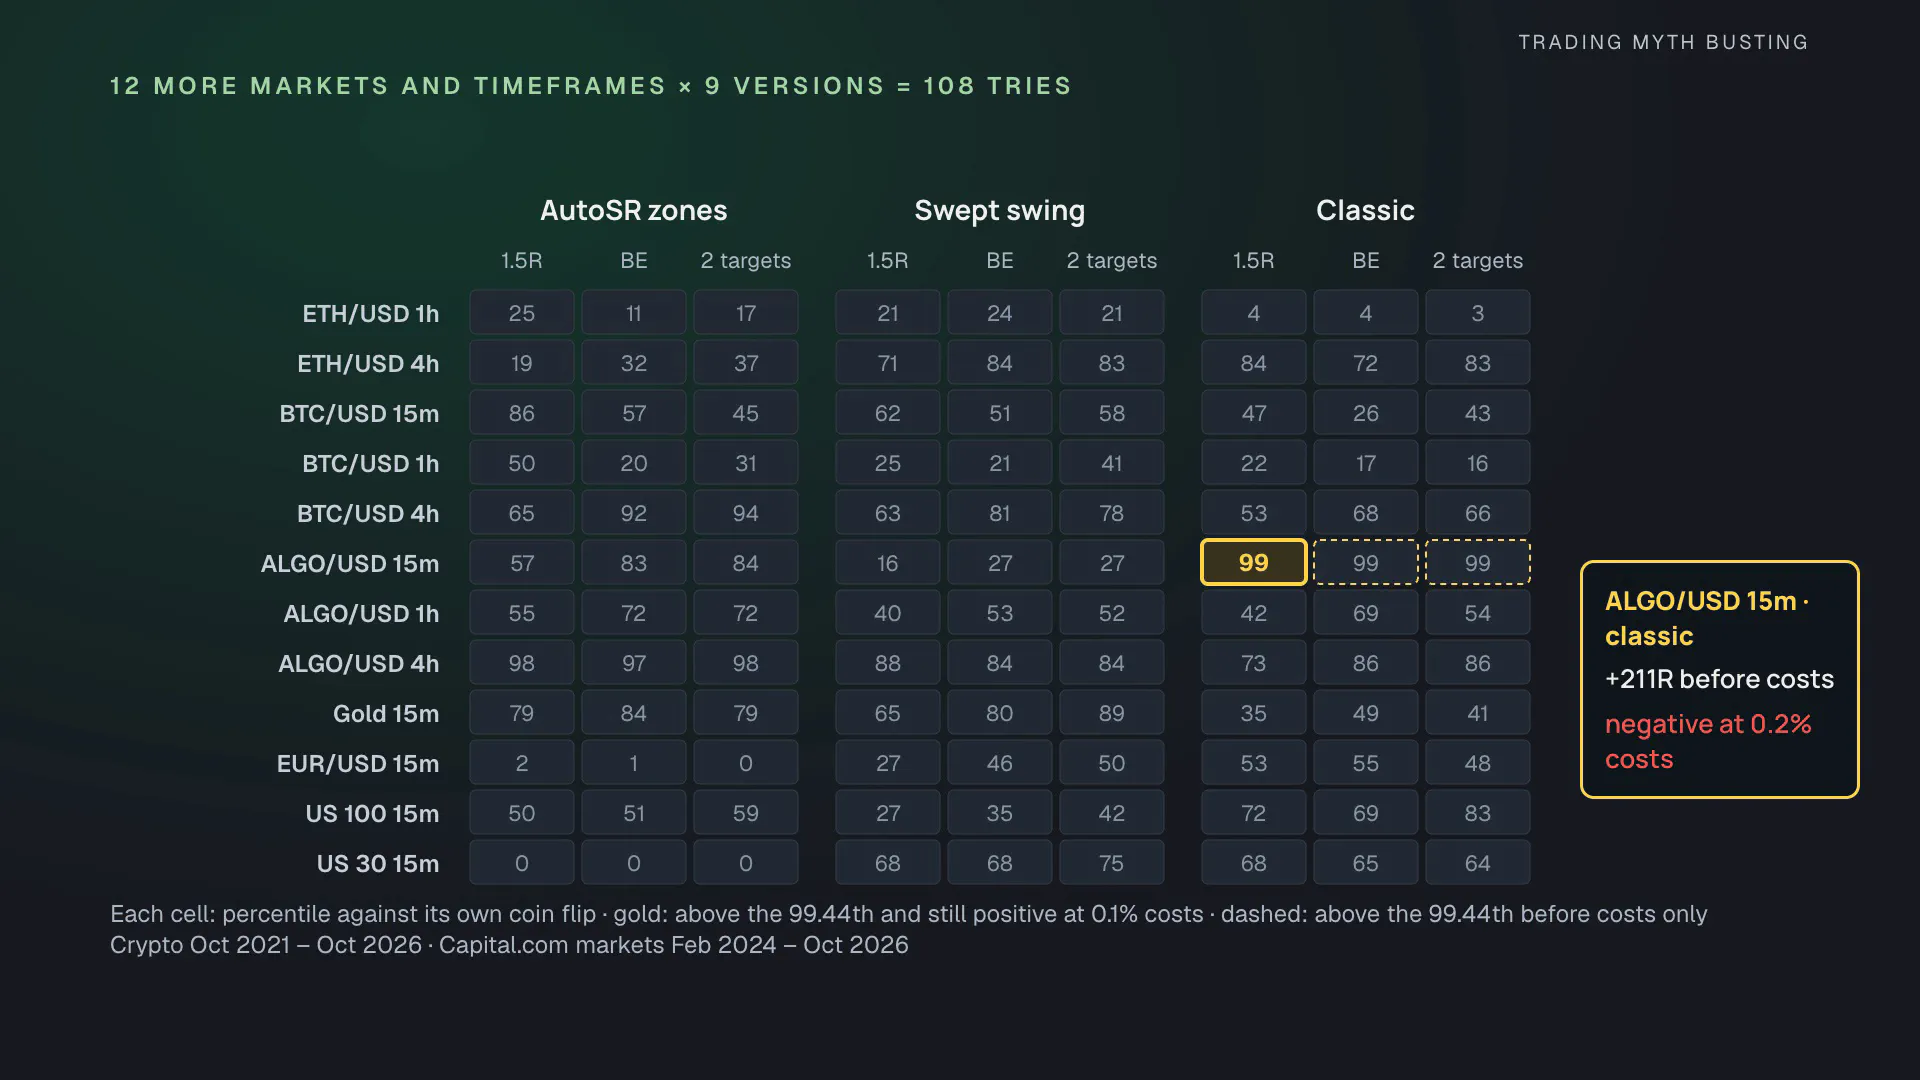
There is one more trap. We ran all 9 versions on 12 more markets and timeframes: Ethereum 1h and 4h; bitcoin and Algorand 15m, 1h and 4h; gold, EUR/USD, the Nasdaq 100 and the Dow 15m. That is 108 more tries. One cleared our strictest bar: the classic version with the original exit on Algorand 15-minute candles, +211R before costs over 2,069 trades (44.1% won), +34R at 0.1% costs and negative at 0.2%. With 108 tries, about 0.6 such results are expected from luck alone. That is why the bar rises with every try, and why one winner out of 108 isn’t a strategy. On the same market the break-even and two-target exits did worse than the original exit.
One more exploratory row, closest to Trade Pro’s 2021 test: the classic version with two targets on EUR/USD 30-minute Capital.com candles, February 2024 to October 2026. 401 trades; 54.1% “wins” his way, 26.4% reached both targets; +34.5R before costs, at the 97.8th percentile of its coin draws, under the corrected bar. A similar picture to his, and still not an edge we can show.
3 questions before you trust a fix
- What counts as a win? Break-even turns some losses into zeros. Half targets turn some wins into halves. A higher win rate can hide a smaller average trade.
- Was it tested on the same entries? If not, you are comparing different trades, not different exits.
- Does it beat a coin that gets the same fix? These didn’t.

Reproduce it
- The script: MACD + 200 EMA + Support/Resistance, part 1’s script, updated with the exits and readings tested here; Pine source, MPL-2.0. The defaults are still part 1’s rules (AutoSRZones levels, stop at the EMA, a single 1.5R target). The Exit input switches to Break-even stop or Two targets; the Support reading and Stop inputs give Trade Pro’s readings (Swept swing level with Lower of EMA and pullback; None with ATR band). It needs the public AutoSRZones library.
- Every trade: all-trades.csv lists every trade of the 9 versions on Ethereum 15m: entry and exit time, direction, entry, stop, risk, R in the main view and with the stop first, and the R of each half for two targets. The period column marks the 5 years after the video, the year before it, and the warm-up trades before that, which are not counted. A trade with
gapset to True filled beyond its stop; it has no R and is excluded, as the plan says. - Every result: all-results.csv holds the 9 main versions, the 108 results on 12 more markets and timeframes, the 17 sensitivity variants and the 3 exploratory checks, after and before the video where measured: trade counts, win rates with 95% intervals, the share reaching the full target, R before costs and at 0.1% and 0.2% per round trip, profit factor, worst drawdown and the coin-flip percentile.
- The IDE in the video: PyneIDE, our IDE for Pine Script inside Visual Studio Code. It runs scripts locally on PyneCore, the open-source Pine runtime.
Data and assumptions. The data is part 1’s, hash-checked against its manifest: Coinbase ETH/USD, BTC/USD and ALGO/USD 15-minute and 1-hour candles, with 4-hour candles built from the 1-hour ones. The main period is October 4, 2021 to October 31, 2026, after the video; the year before it is October 1, 2020 to October 3, 2021. Gold, EUR/USD, the Nasdaq 100, the Dow and the exploratory EUR/USD 30m are Capital.com CFD bid prices, with trades counted from February 2024 to October 2026. The results come from a trade simulator on the script’s signals; the published script was checked against it trade for trade in all 9 versions, and in TradingView’s own engine on recent Ethereum candles (772 of 772 trade records identical on TradingView’s candles). When a candle touches both a stop and a target, the main view follows TradingView’s assumption about the order inside the candle; counting the stop first leaves every version the same or worse and changes no verdict. A trade whose candle opens past its stop or target closes at that open (the gap exits). The costs are a scenario deducted from the fills, not measured broker costs; on forex, 0.1% is far more than a real spread, so the EUR/USD rows at that cost are only indicative. The $1,000 accounts are simulated from the backtest trades and are an illustration, not a registered test. The swept-swing and ATR readings are our rules for Trade Pro’s descriptions, not his exact process, and the comparison with his results is exploratory. The PyneIDE runs in the video use part 1’s recording file of the period after the video, which starts with a warm-up of its own, so the original exit shows 1,126 trades and 37.8% there; the research numbers above come from the full data.
If you get a different result, include the symbol, dates, settings and costs so we can compare the experiments.