
Myth Busting · Episode 05
The ORB One-Candle Strategy, "Backtested 1,000 Times", Tested: 34% Before Costs, 27% After the Spread
TL;DR: A video with more than 40,000 views ends on a results card: 1,308 trades, a 59.15% win rate and a profit factor of 4.15. With a target of 2 times the risk, the strategy needs 33.3% just to break even. On AMD, Tesla, Apple and Nvidia, 1-minute candles from January 2024 to November 2026, the rules won 33.9% of 1,463 trades (95% interval 31.5–36.4%) with a profit factor of 1.03 before costs, and did no better than random directions. With the spread paid on every fill, they won 26.9% and the profit factor fell to 0.52. The typical stop was 43 cents away; the typical spread at entry was 13 cents. Script, every trade and the data notes are below.
The claim
The video is Scarface Trades’ Once You Learn The ORB Strategy, Trading Becomes Easy (Backtested 1,000 Times), published November 3, 2026. It explains the strategy clearly and shows a full week of trades on AMD, the losing day and the days without a trade included. It calls the strategy “a repeatable and mechanical strategy” (3:10), and it ends with a results card: 1,308 trades, a 59.15% win rate and a profit factor of 4.15 (17:16). The card doesn’t say which stocks, which dates, what size or what it cost.
We test trading claims the same way every time: write the rules down before any test, turn them into code, run them on fixed data and keep every result. For this episode the test plan was registered on November 12, 2026, 10:47 UTC, before a single strategy run, and its SHA-256 hash was recorded. Later changes are marked as such in the research record.
What 59% would mean
The strategy aims for 2 times its risk. At that payout it only needs 1 ÷ (1 + 2) = 33.3% to break even, and 59% would be a money machine. So the questions are simple: does it win clearly more than 33% of its trades, does it beat chance, and what is left after costs?
The rules
- Opening range: the high and the low of the first 5 minutes after the 9:30 New York open.
- Breakout: wait for a 1-minute candle to close outside that range.
- Retest: wait for price to come back to the broken level. If it shows “weak price action” there, enter in the breakout direction. The stop goes just past the entry candle, the target is 2 times the risk.
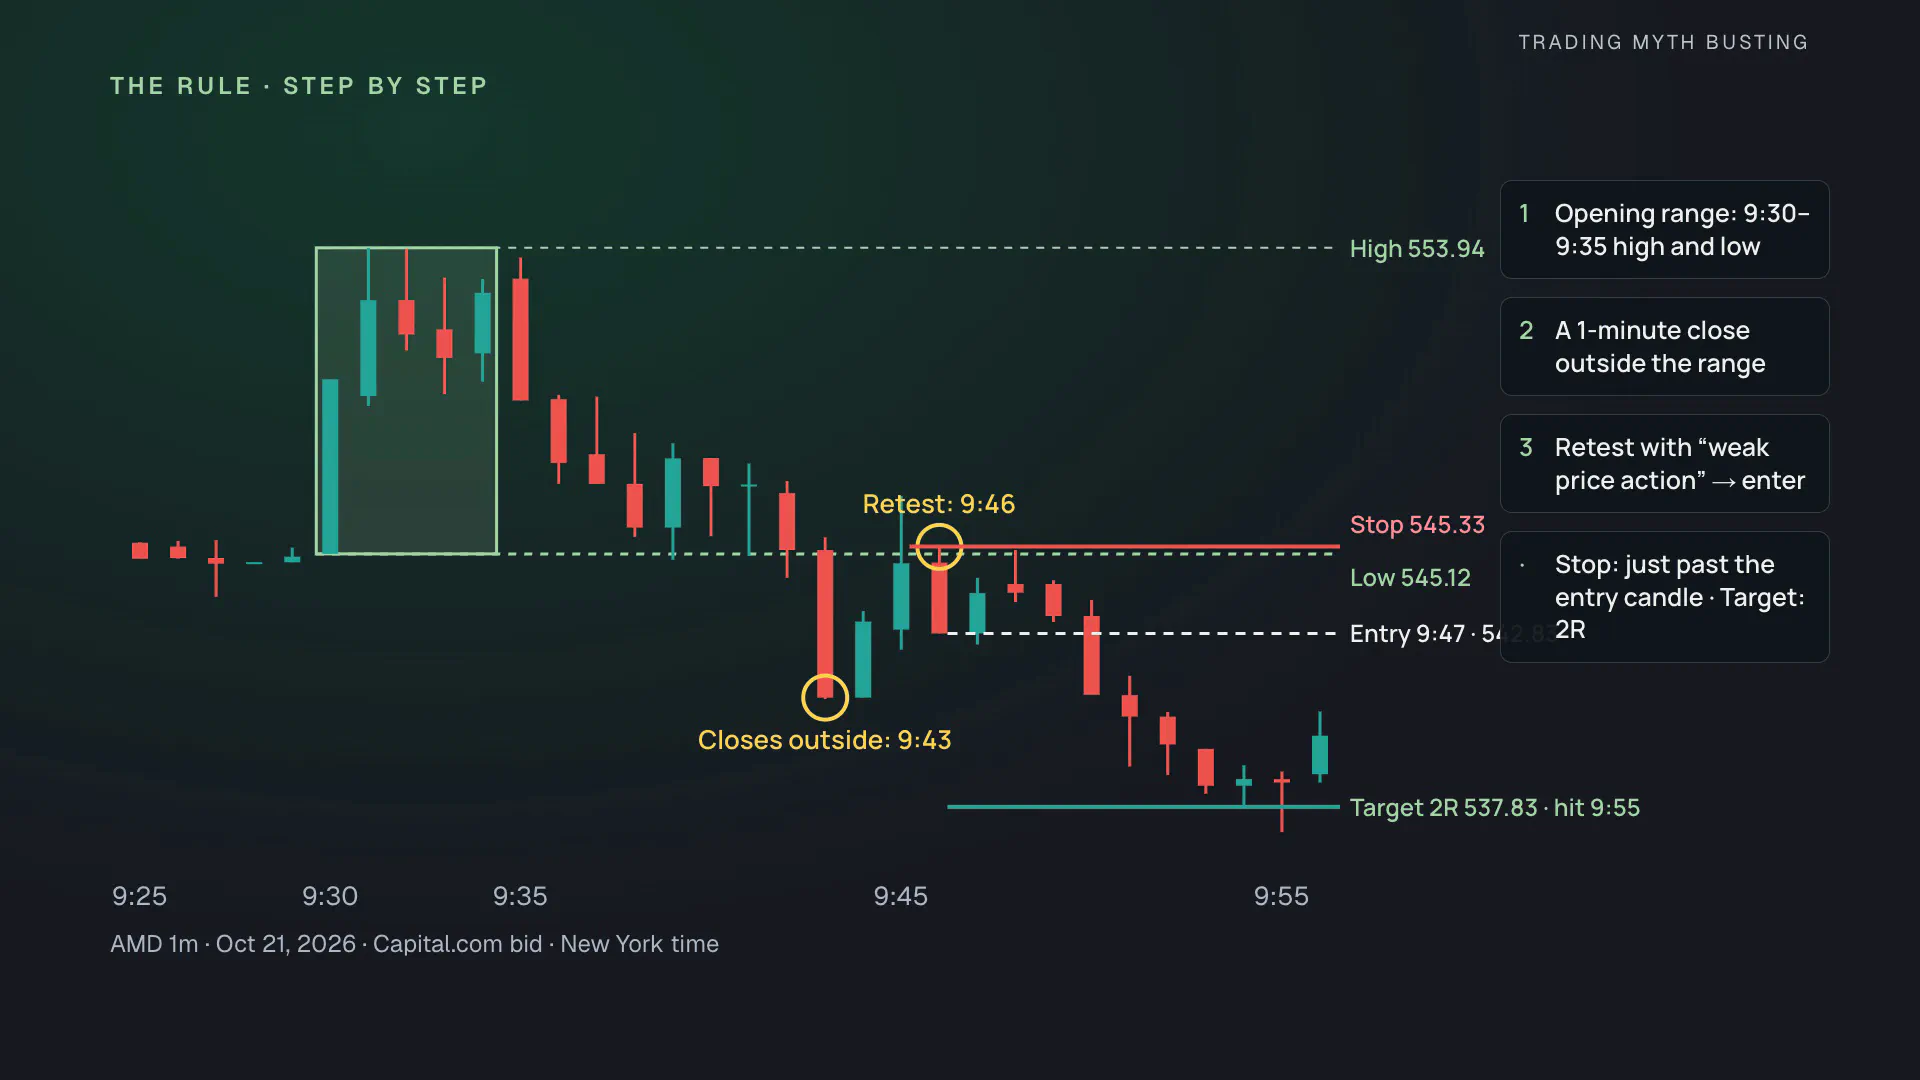
Steps 1 and 2 are easy to code. Step 3 isn’t: the video never defines weak price action. So we wrote down 3 readings and locked all of them before the first run:
- Rejection candle (the main reading): one candle touches the level, closes back on the breakout side and closes in the breakout direction.
- Close after touch: after any touch, the first candle that closes beyond the level in the breakout direction.
- Hammer: a candle at the level whose wick against the breakout is at least twice its body.
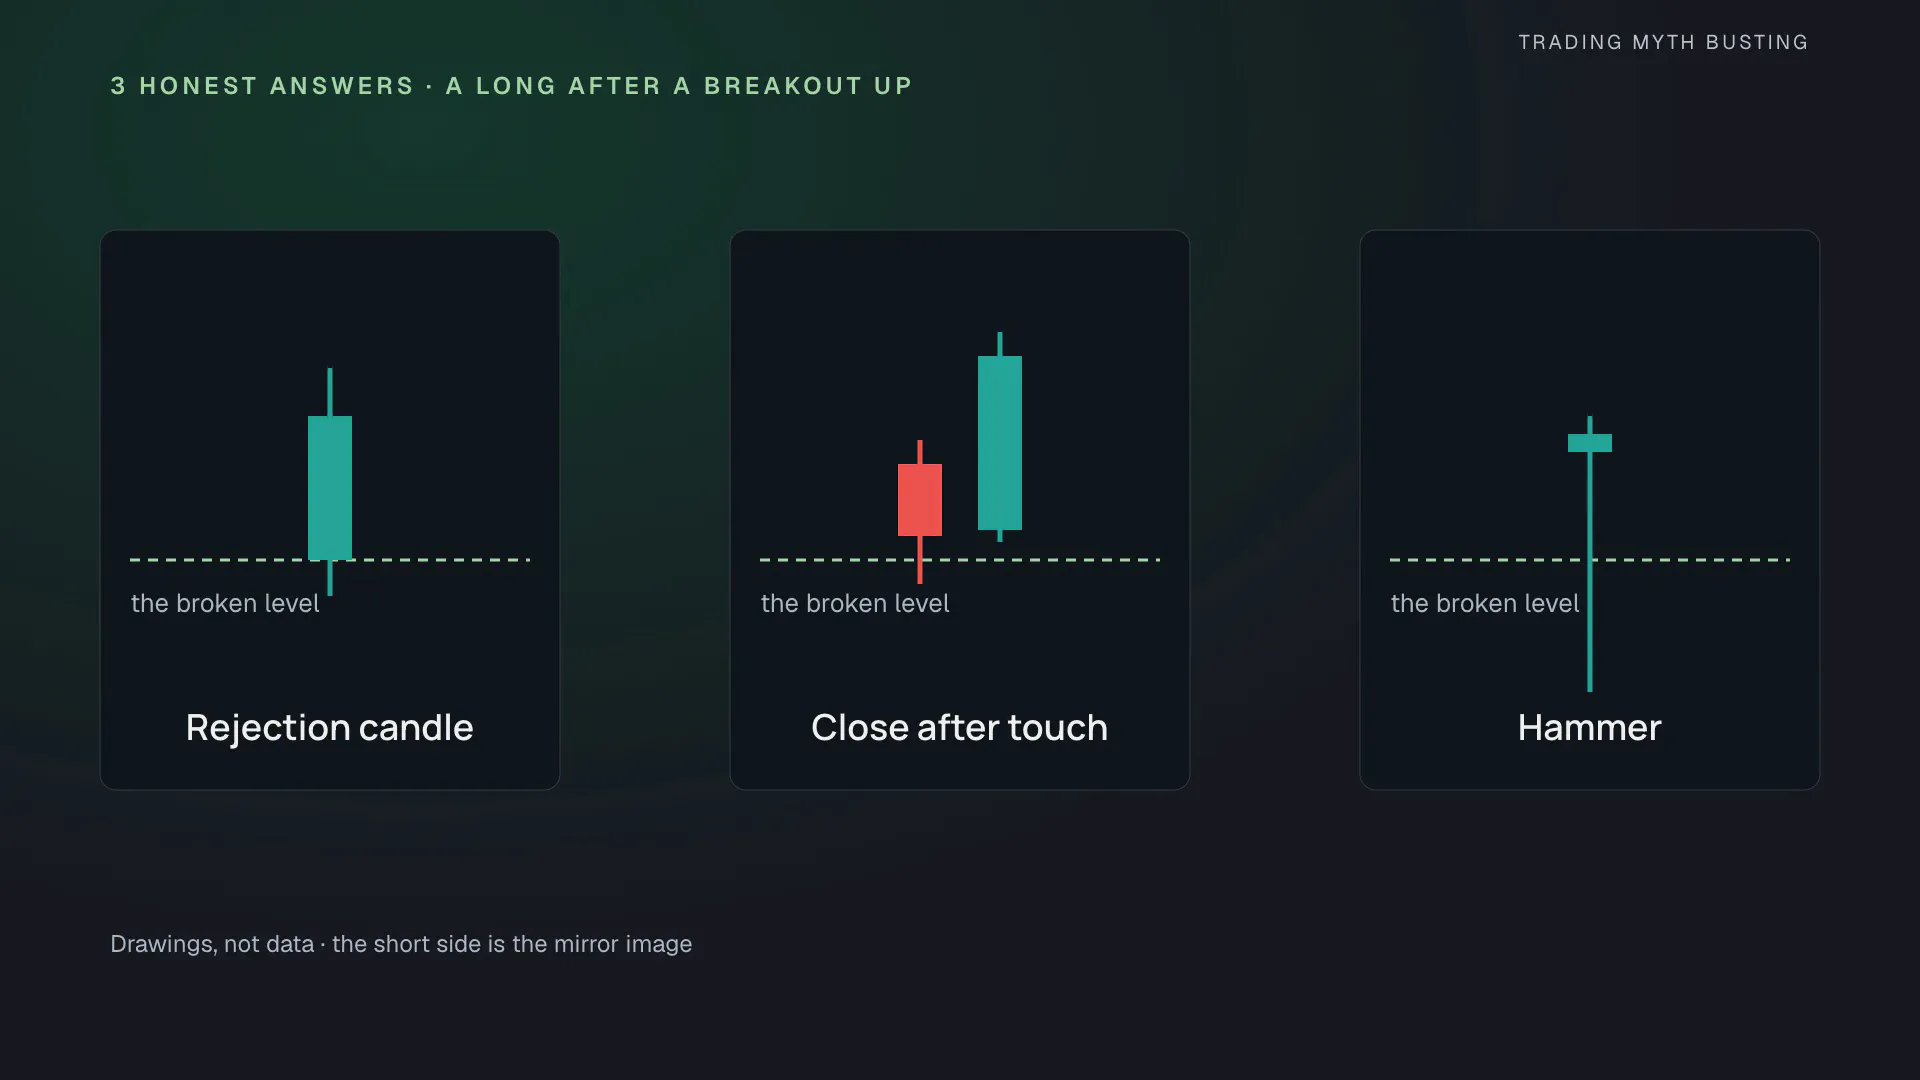
In the script, the main reading is two conditions per side:
bool longTouch = low <= rangeHigh + tolerance
bool longClosesUp = close > rangeHigh and close > open
Where the video leaves room, the plan fixes the details: a touch means coming within 5% of the range’s height; a close back inside the range before an entry cancels that side for the day; signals until 10:30, and an open trade is closed at 11:00 New York time; at most one trade per direction per day.
The week the video shows
First, the week from the video, on the same stock and the same days, in PyneIDE on Capital.com data. With the rejection candle, day 1 goes short at 9:47 and hits its target, days 2 and 5 are stopped out, and the week ends at −0.2R. Switch one input to the hammer and run it again: day 1 enters at 9:49 and hits the target a minute later, just like the video, day 2 matches too, and the week ends at +3.1R.
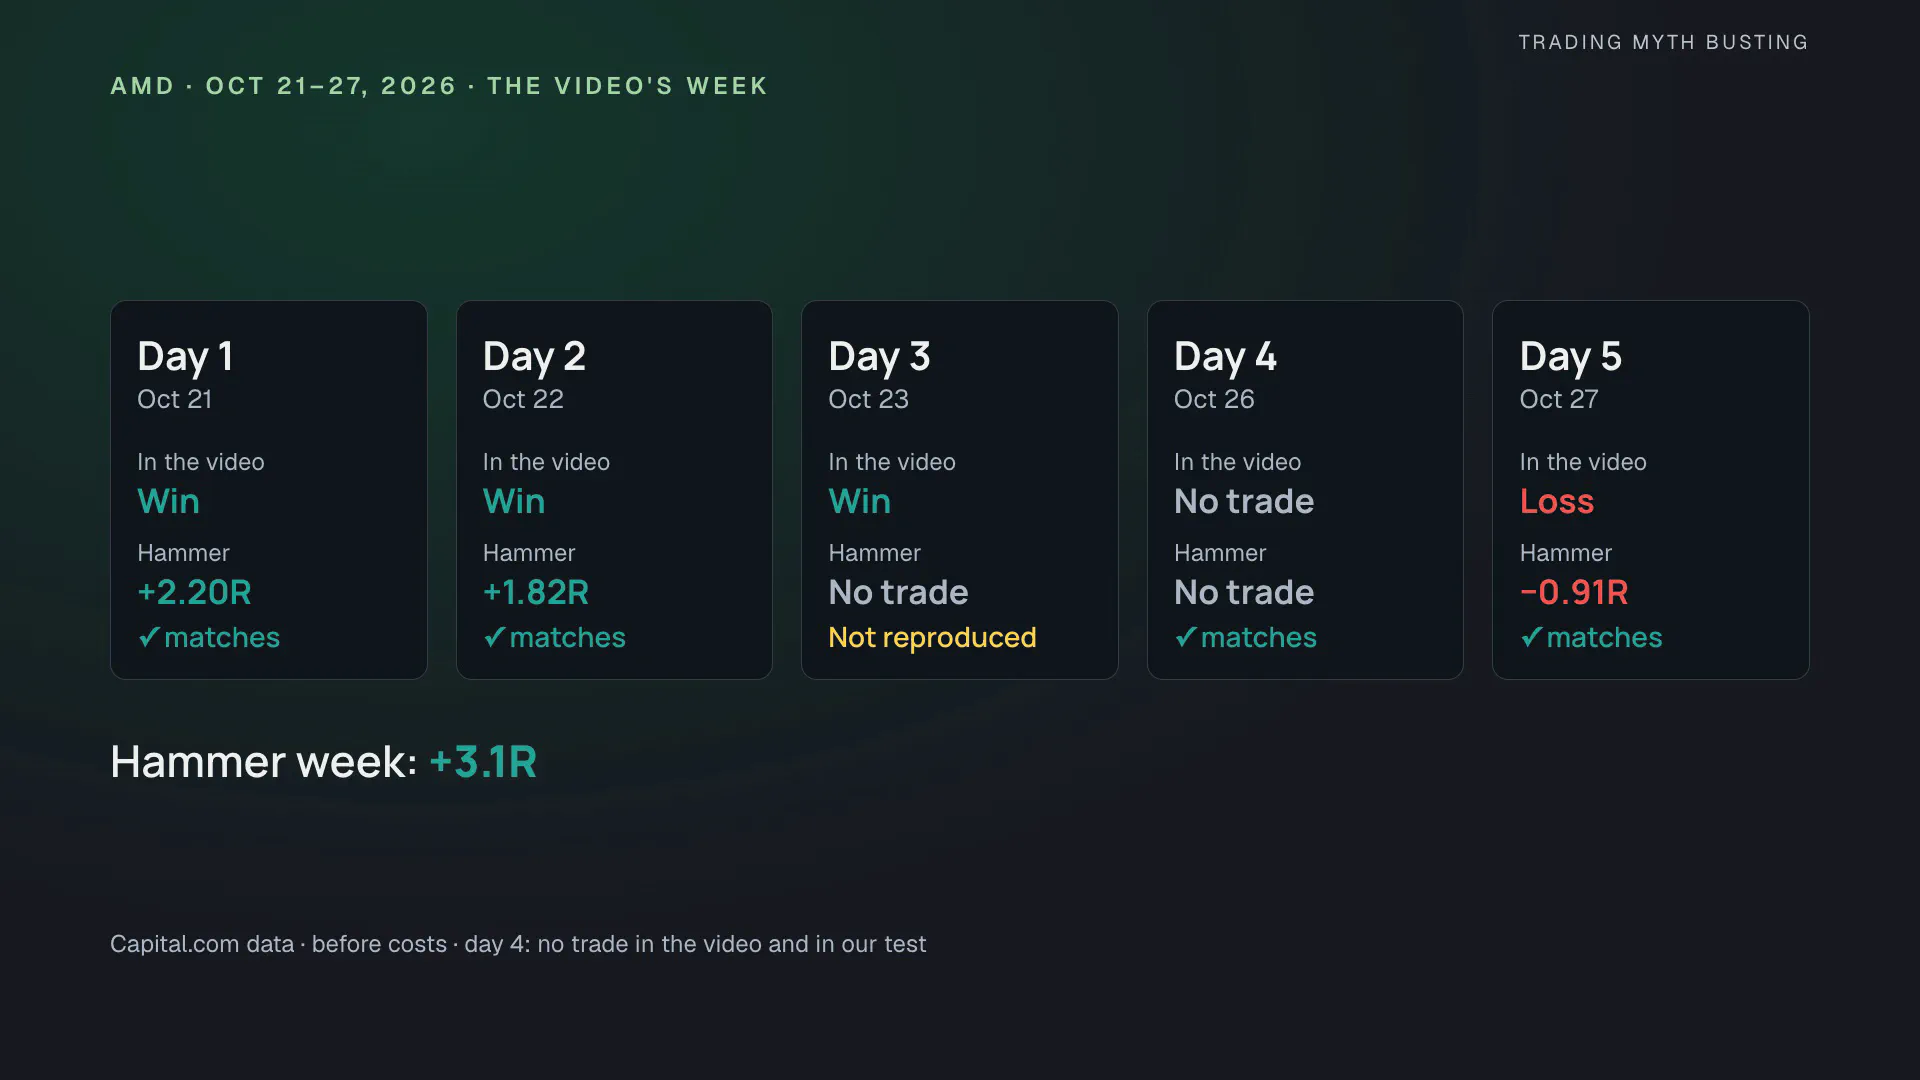
Day 3 no reading reproduces. In the video it is a judgment trade, with a stop behind 2 candles and a target at the day’s high, and neither is in the stated rules. Still, with the right reading, 2 of the 3 winning days come back. So far, the video holds up.
Is it mechanical?
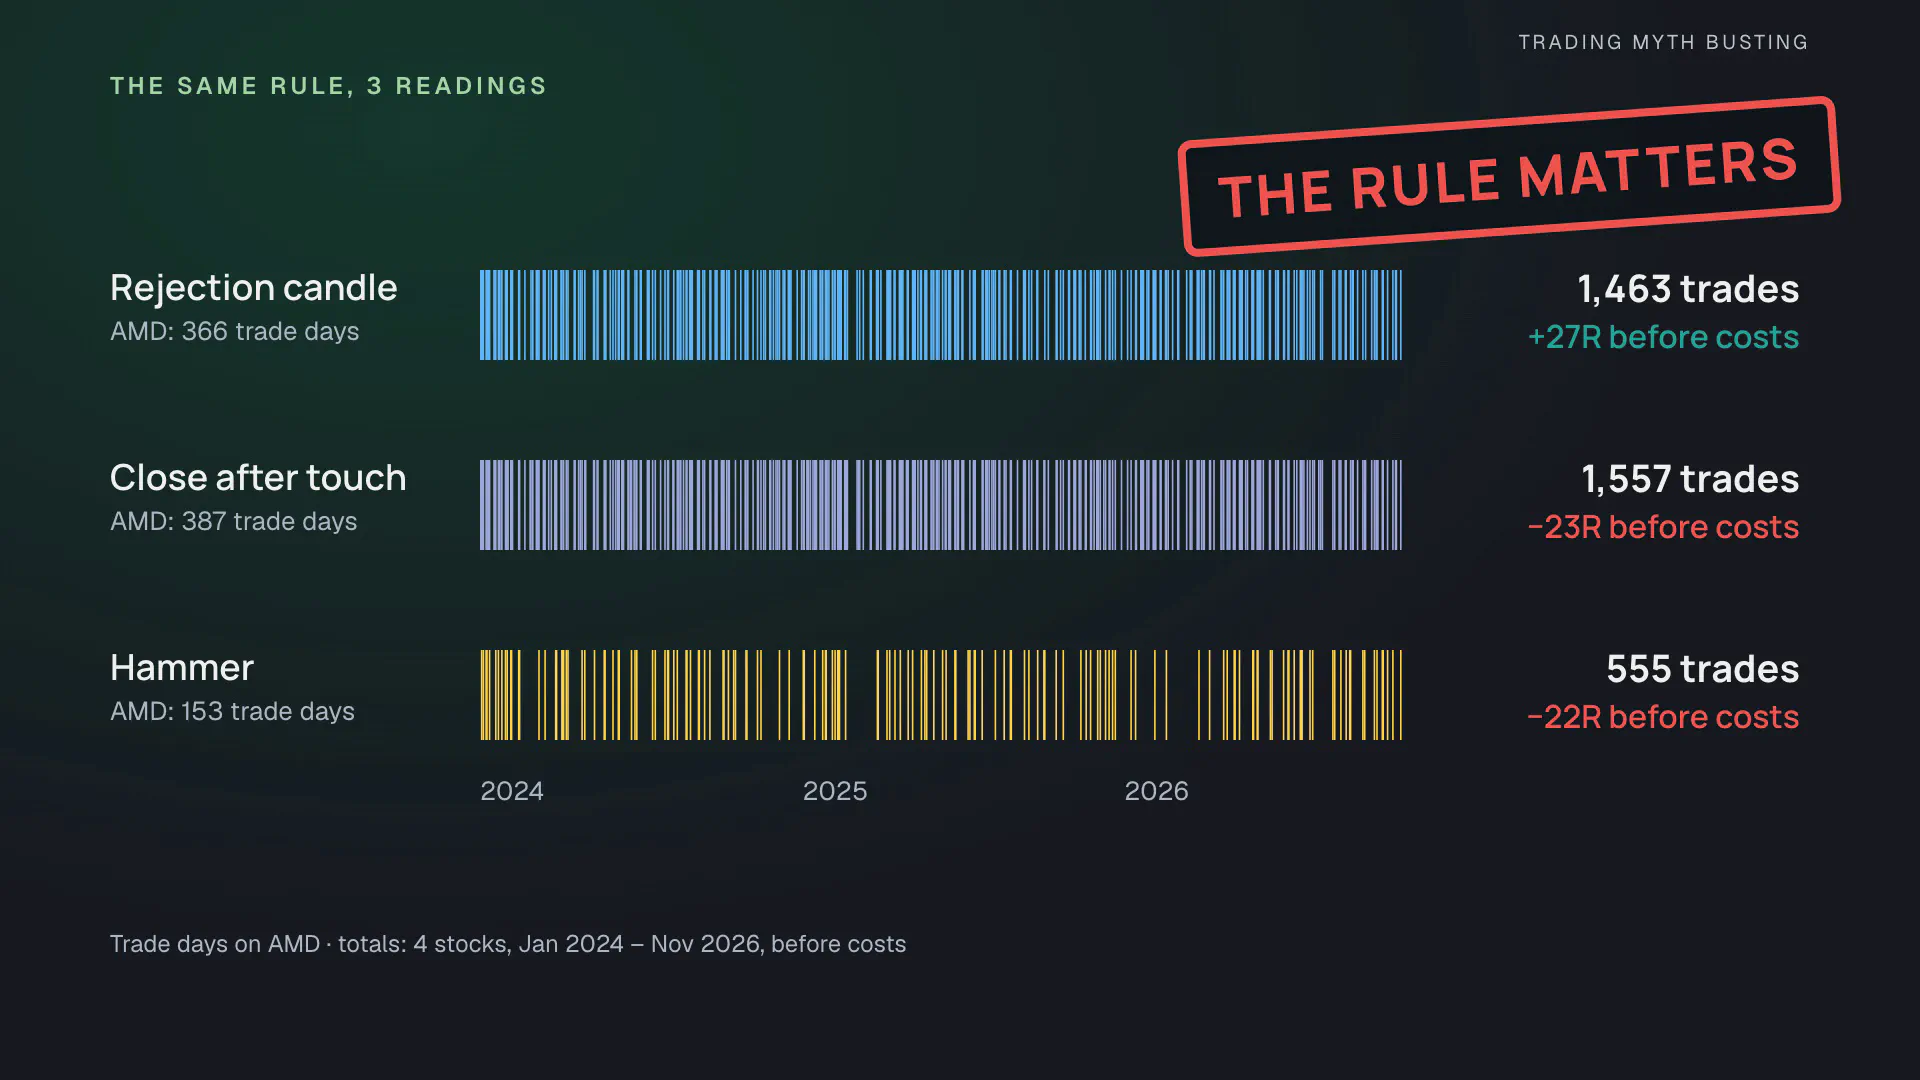
The week just changed with one input, so we ran all 3 readings over almost 3 years. They don’t even trade on the same days. Before costs:
| Retest rule | Trades | Win rate | Profit factor | Total R |
|---|---|---|---|---|
| Rejection candle | 1,463 | 33.9% | 1.03 | +27.4R |
| Close after touch | 1,557 | 32.8% | 0.98 | −22.7R |
| Hammer | 555 | 31.9% | 0.94 | −21.9R |
The difference between the rejection candle and the close after touch is measurable (+0.033R per trade, 95% interval +0.010 to +0.056R). The step that decides the result is the one the video doesn’t define.
We gave it $1,000
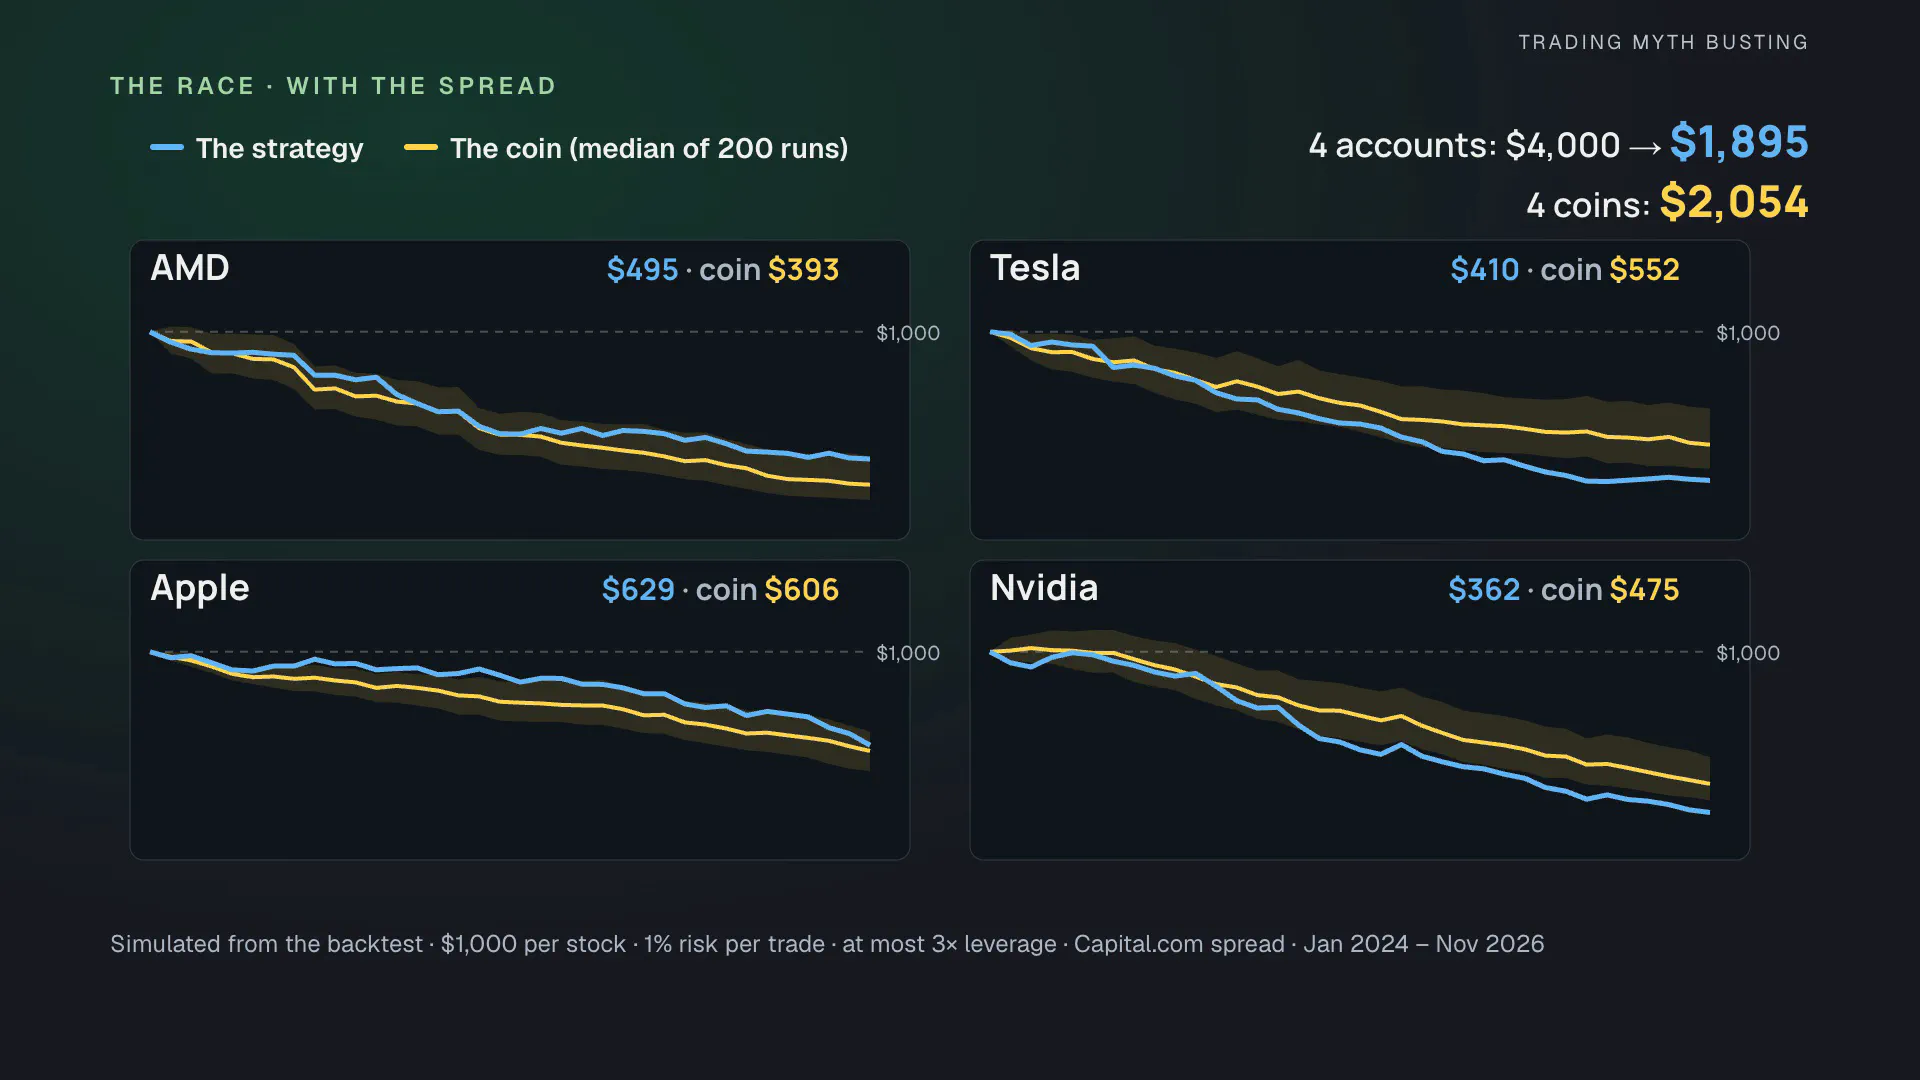
Each of the 4 stocks gets its own simulated $1,000 account. It risks 1% per trade, with at most 3 times leverage, a cautious limit for a small account. A coin gets the same entries, the same stop and the same target, and only picks the direction; its curve is the median of 200 full runs, with the band from the 10th to the 90th percentile.
Counted the way a normal backtest counts it, every fill at the chart price, AMD and Apple climb and Tesla and Nvidia slide. After almost 3 years, the 4 strategy accounts hold $4,229. The 4 coins hold $4,295.
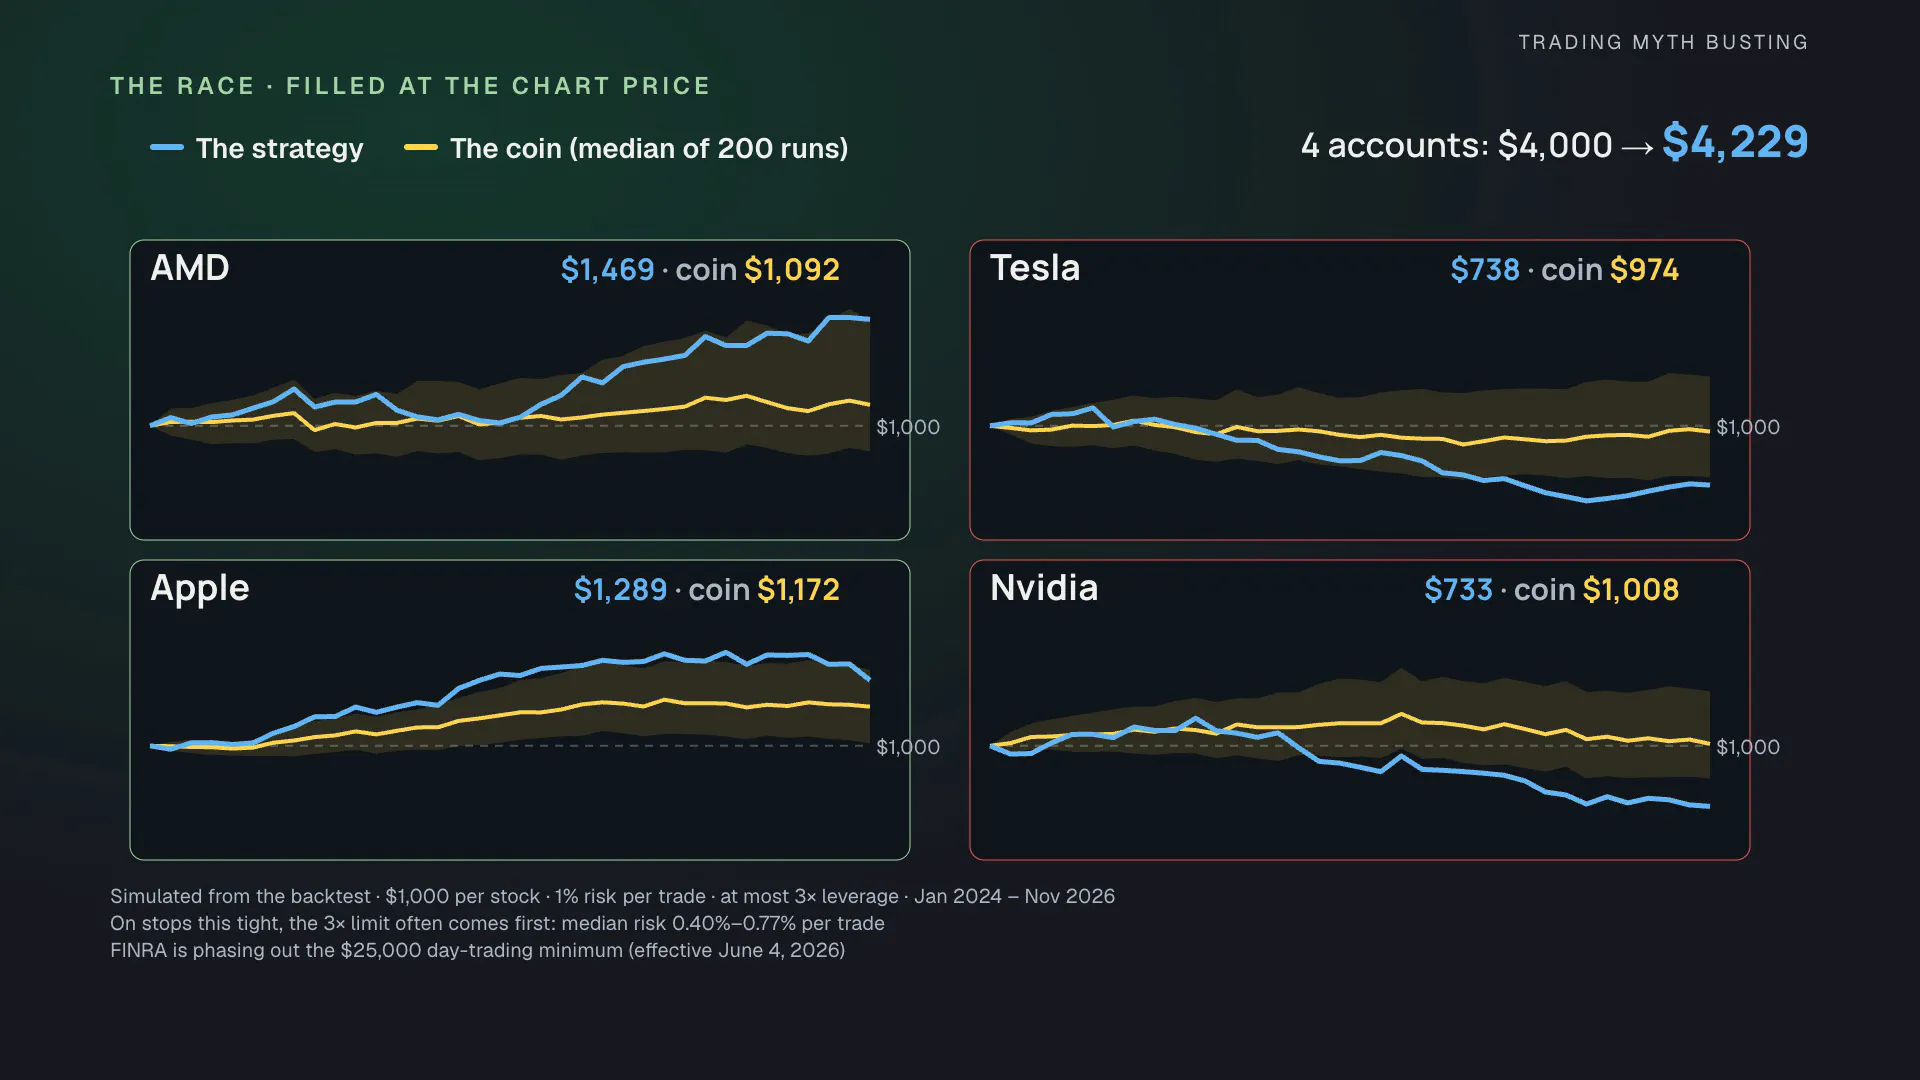
Measured in R on the whole basket, the real rules beat only 19.5% of the 200 coin runs: no edge over a coin flip. The coin’s median was +77.3R against the strategy’s +27.4R. Split by direction, the coin’s trades with the breakout averaged +0.017R, the same as the strategy, and its trades against the breakout +0.084R. We didn’t plan to test that, so it is a hint, not a strategy, and with the spread it loses too.
The bill your backtest leaves out
Nobody trades at the chart price. You buy at the ask and sell at the bid, and right after the open the gap between them is wider than for the rest of the session. A TradingView backtest fills your orders at the candle’s price; you can add slippage as a fixed number of ticks, but the spread at the open doesn’t stay fixed.
Our Capital.com data stores both sides of every candle, so in PyneIDE the spread is one setting: buys fill at the ask, sells at the bid, and every order is triggered by its own side.
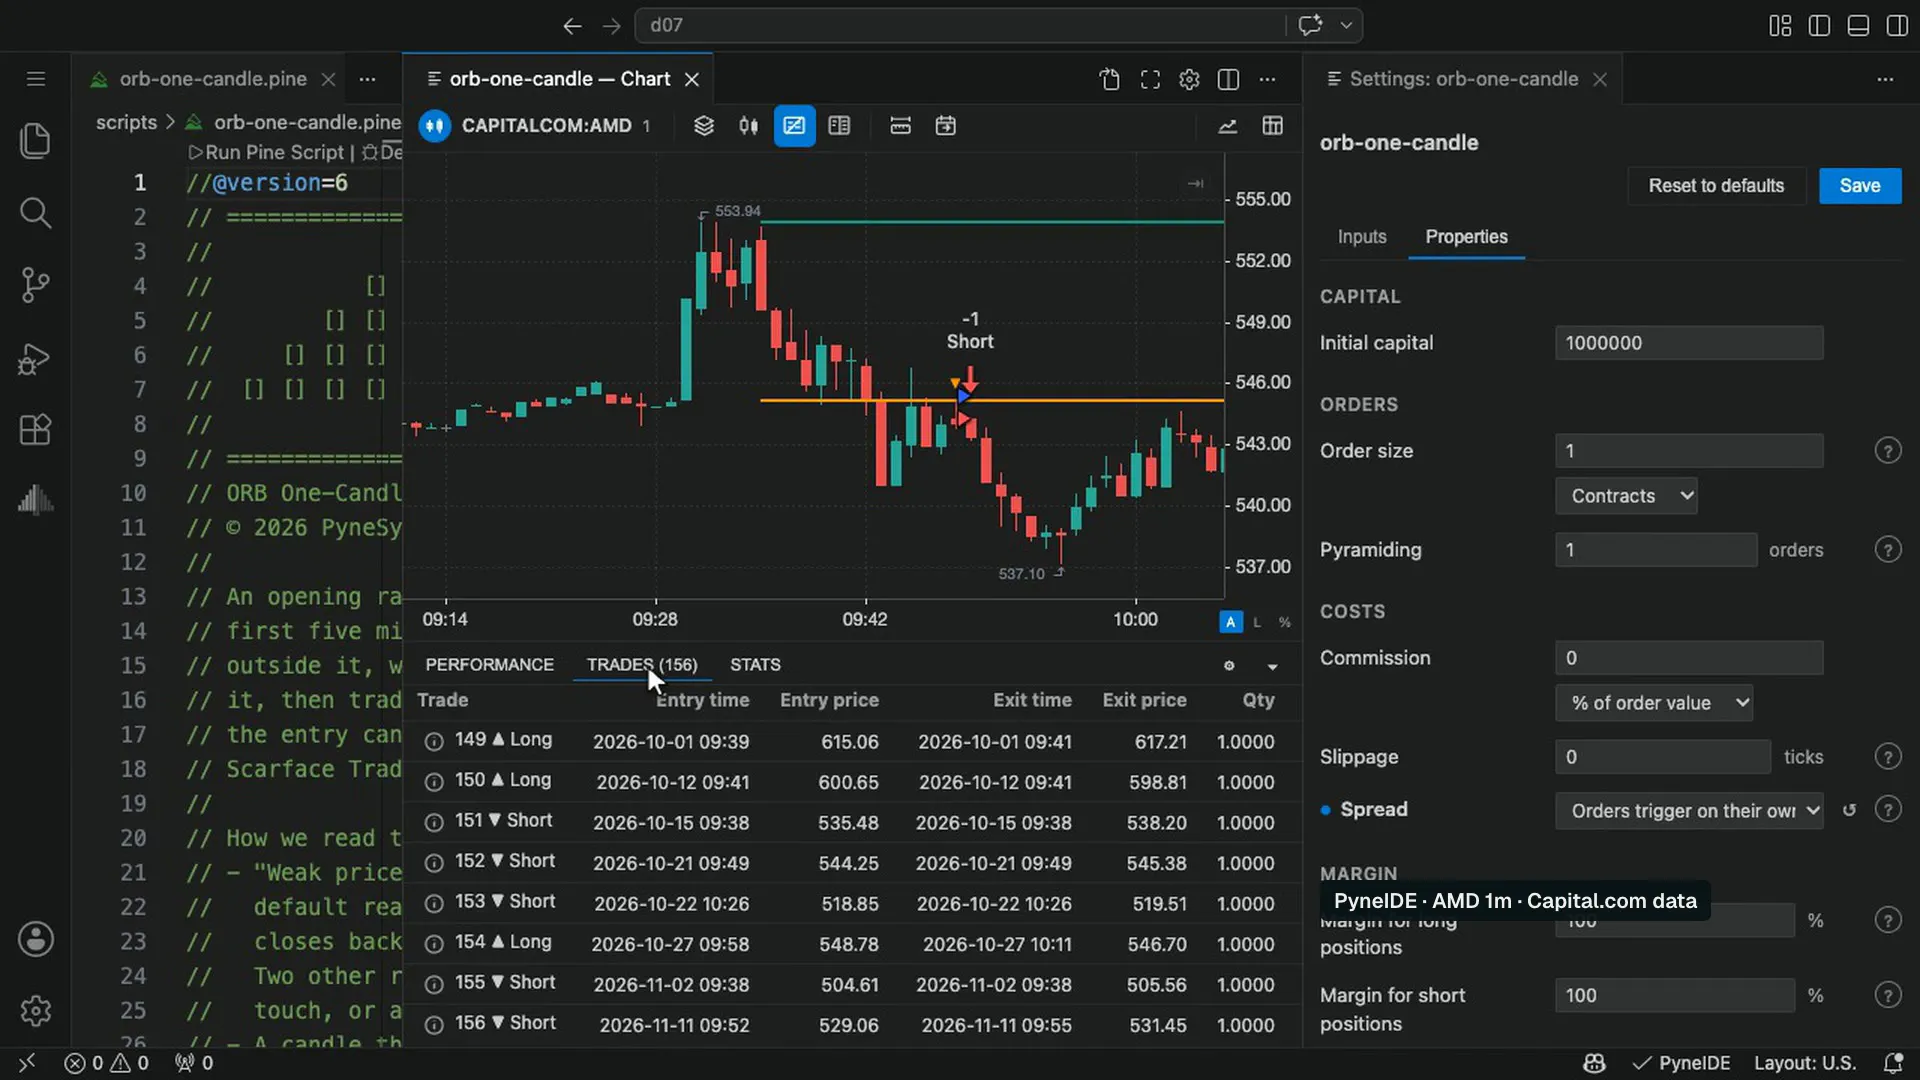
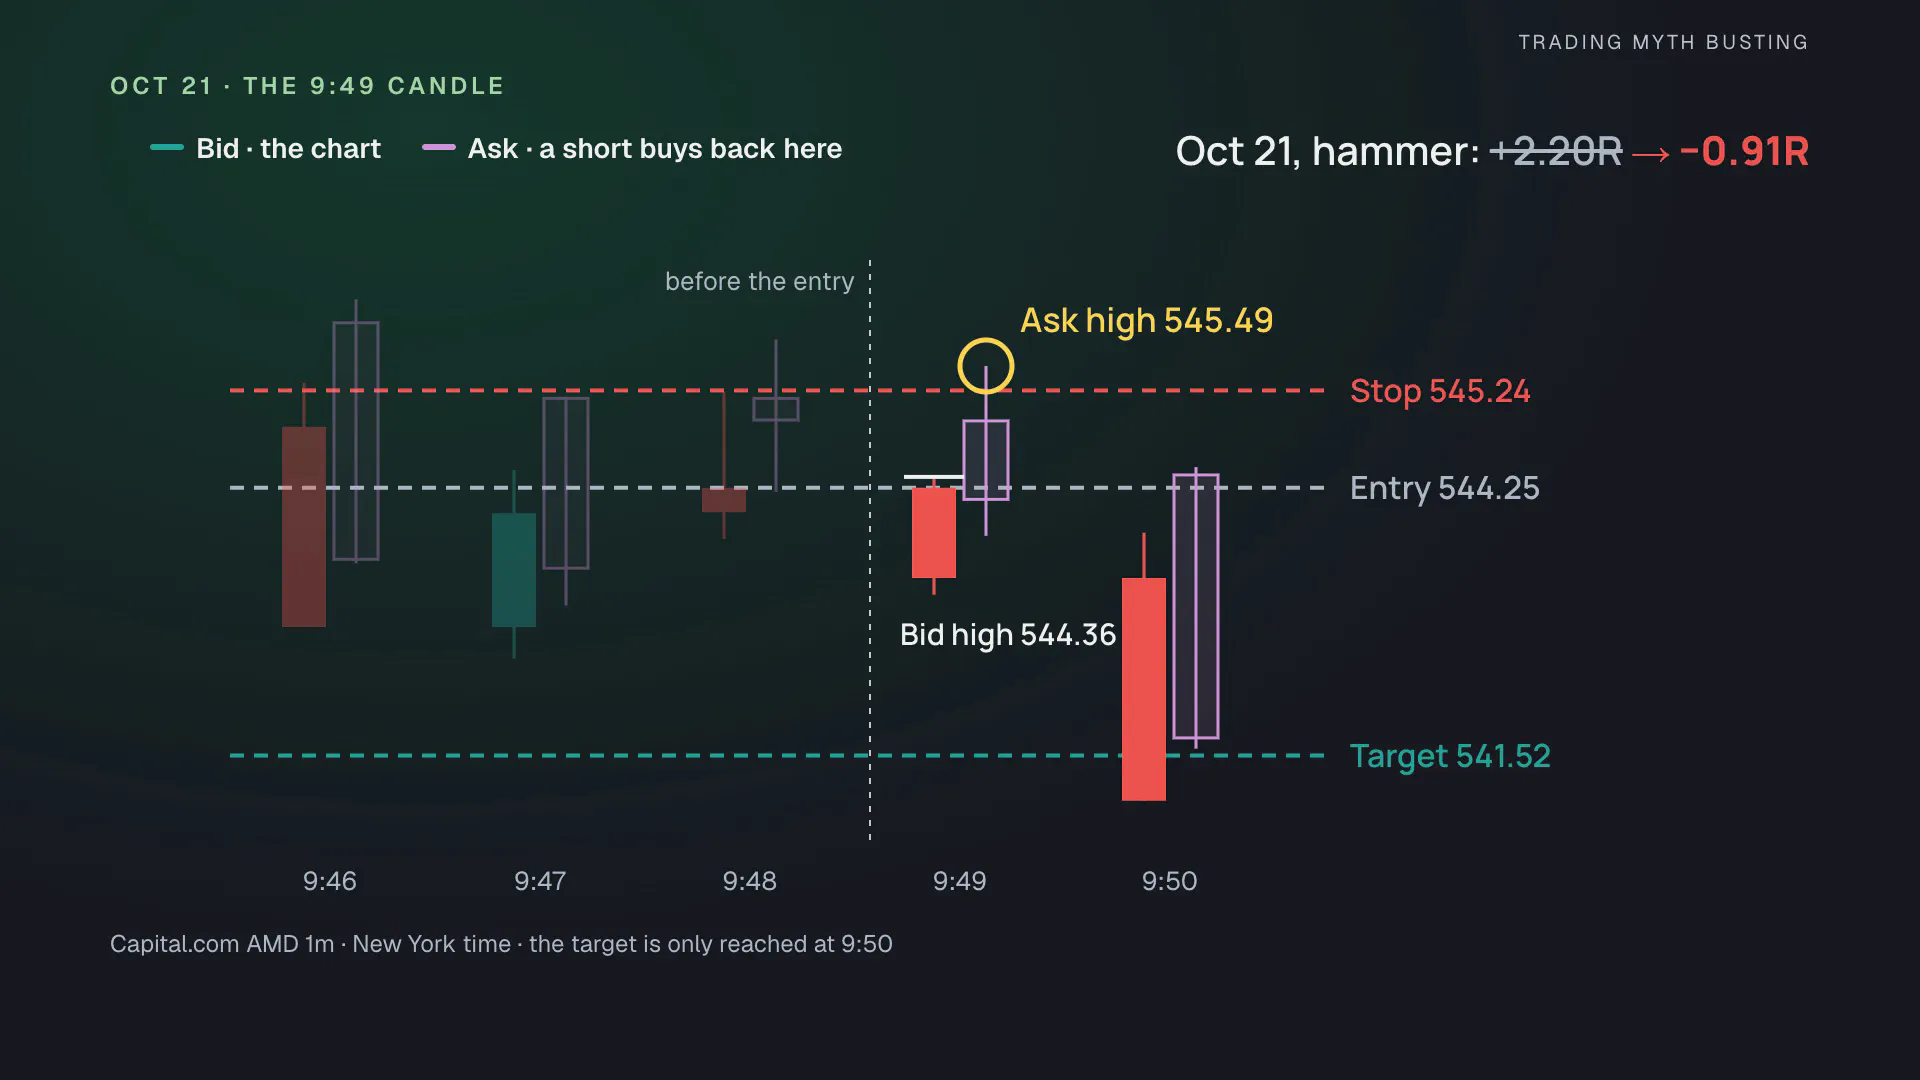
Back to day 1 with the hammer. A short is closed by buying, and you buy at the ask. At 9:49 the ask touches the stop before price ever reaches the target: the winning day becomes a −0.91R loss. Day 2 flips too, and the hammer’s week goes from +3.1R to −3.5R.
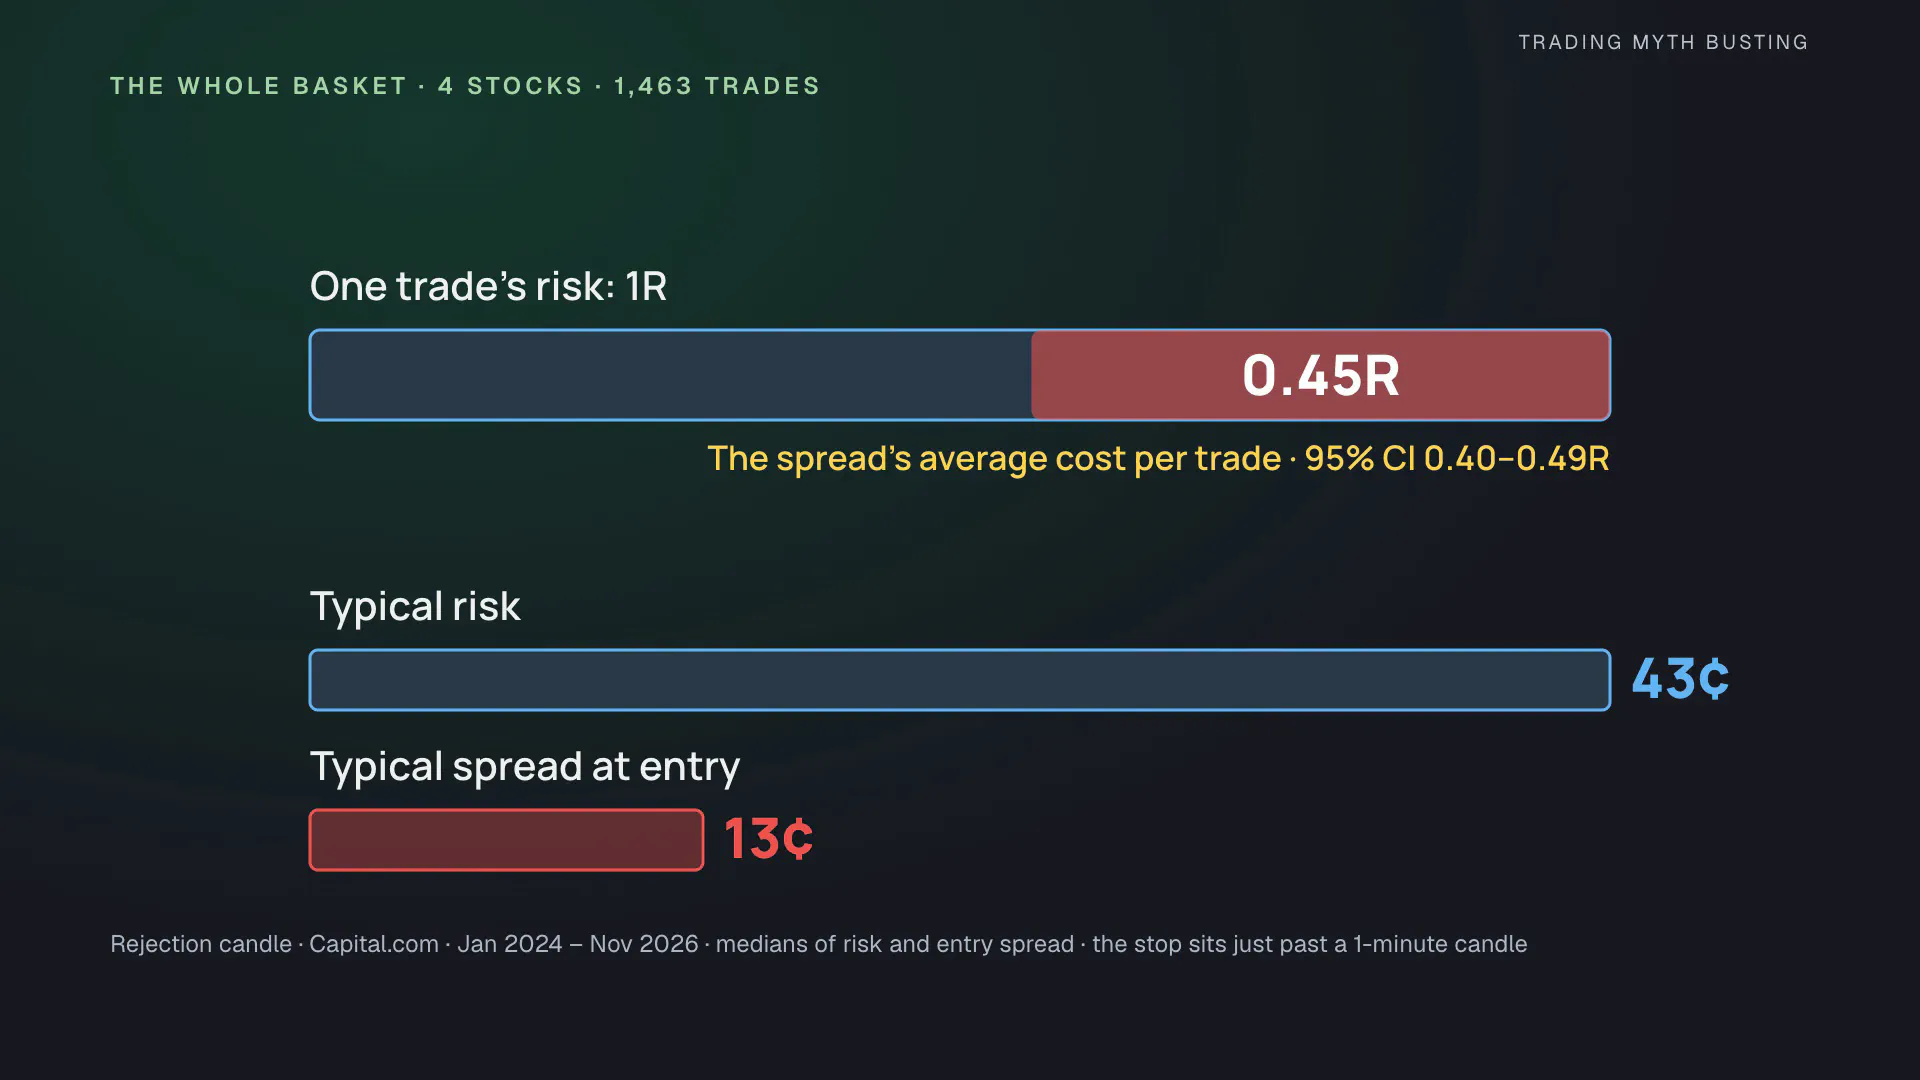
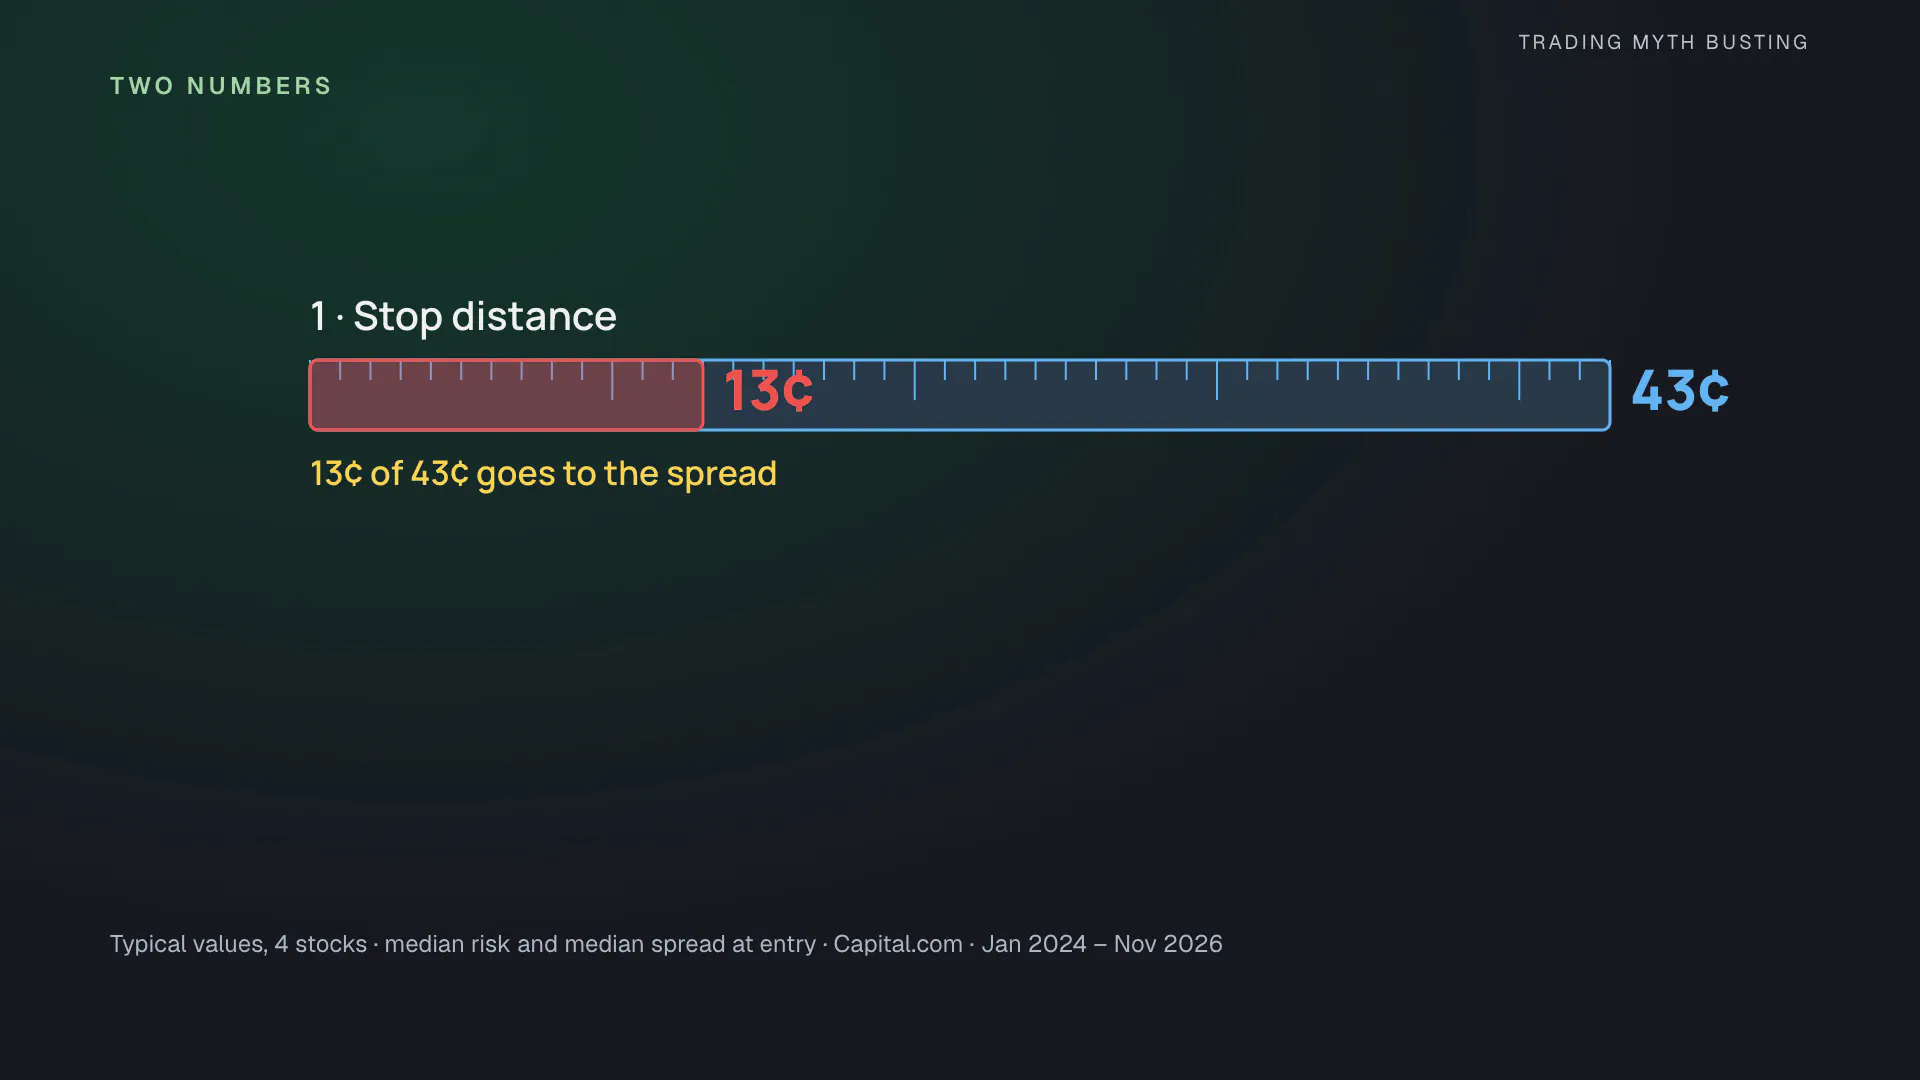
On the whole basket, the spread cost 0.45R per trade on average (95% interval 0.40–0.49R). The reason is the stop: it sits just past a 1-minute candle, so the typical risk was 43 cents, and the typical spread at entry was 13 cents. At the median, the entry spread alone was a third of the risk: 35% on AMD, 23% on Tesla, 42% on Apple and 34% on Nvidia.
| Median spread at the candle’s open | 9:30–9:34 | 9:35–10:59 | 11:00–15:59 |
|---|---|---|---|
| AMD | $0.18 | $0.14 | $0.12 |
| Tesla | $0.22 | $0.16 | $0.14 |
| Apple | $0.16 | $0.12 | $0.12 |
| Nvidia | $0.13 | $0.11 | $0.11 |
With the spread, all 4 accounts slide from the start. Of the $4,000, $1,895 is left. The coins pay the same spread and keep $2,054.
Capital.com is a broker with tight spreads, but it isn’t available in the US. If you trade the shares themselves on a US exchange, your spread is usually much smaller than on these CFDs, and your result moves toward the before-costs one. A short cross-check on exchange prices (August 26 to November 11, 2026) gave the same picture before costs: 108 trades, 33.3% won, a profit factor of 0.96. In forex, the spread is the main cost, and on EUR/USD it took the same share of the risk: 33% at the median.
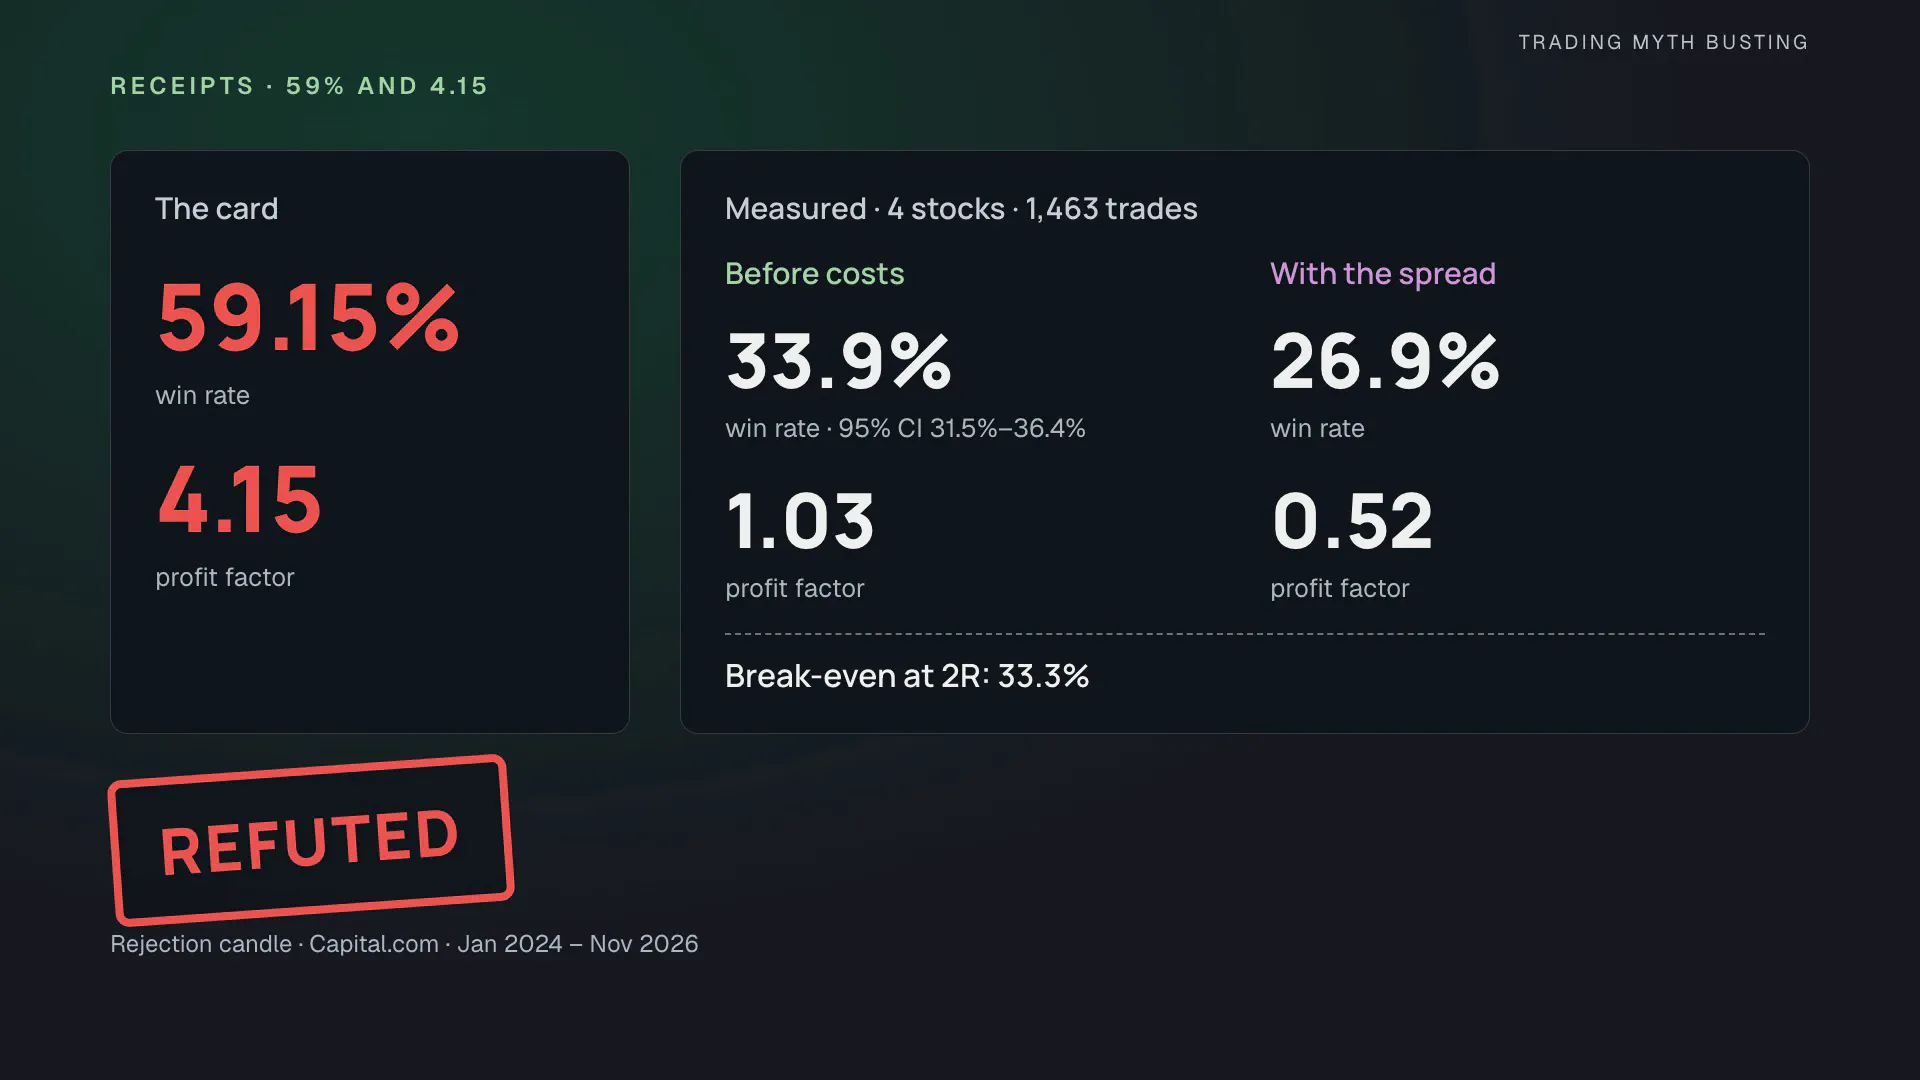
59% and 4.15, checked
| Measure | The card | Before costs | With the spread |
|---|---|---|---|
| Win rate | 59.15% | 33.9% (31.5–36.4%) | 26.9% |
| Profit factor | 4.15 | 1.03 | 0.52 |
The break-even win rate at 2R is 33.3%. We can’t check what the card measured. We can only check these rules, and on these 4 stocks they didn’t come close.
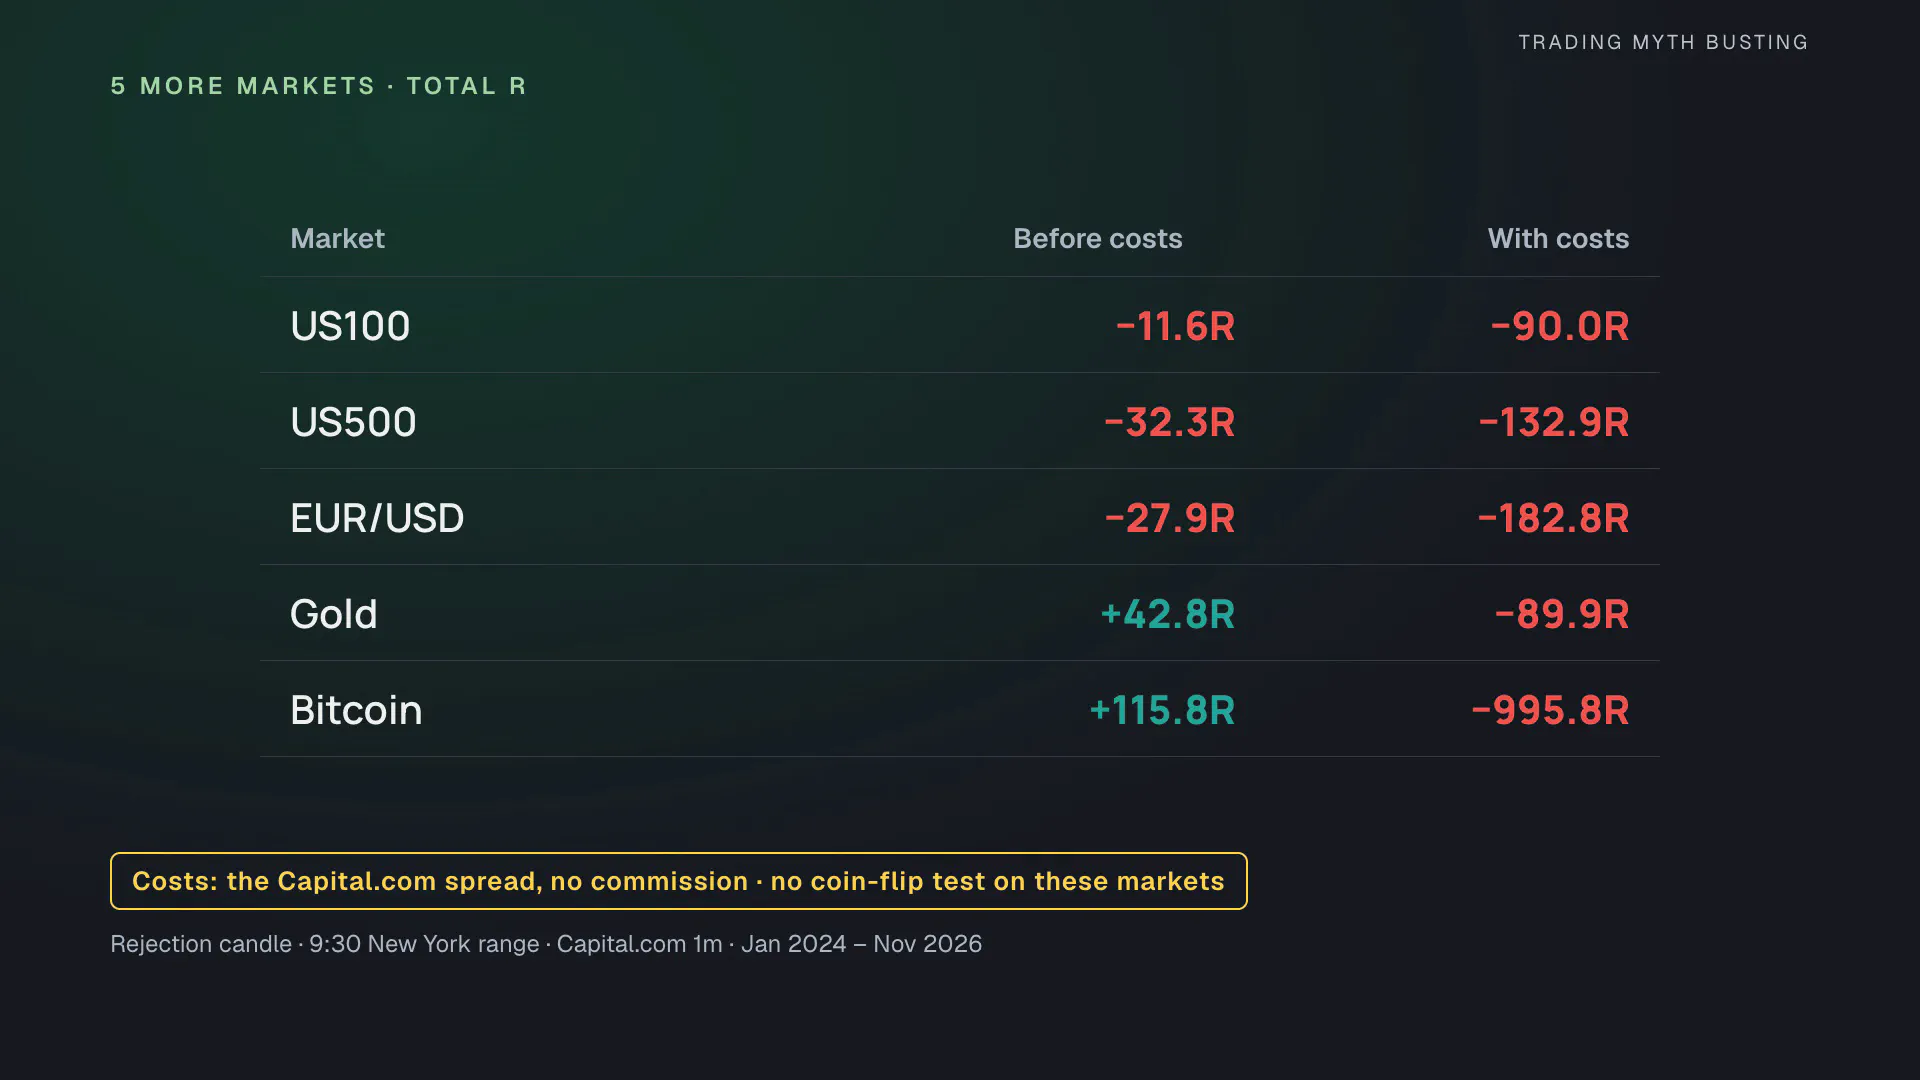
The video also says the strategy works for futures, crypto and forex. We ran 5 more markets with the main reading, the same 9:30 New York range and Capital.com 1-minute candles. Gold and bitcoin looked good before costs. After costs, all 5 lose. There was no coin flip test on these markets, so they carry no verdict about an edge.
| Market | Trades | Win rate before costs | Before costs | With the spread |
|---|---|---|---|---|
| Nasdaq 100 | 433 | 32.6% | −11.6R | −90.0R |
| S&P 500 | 423 | 31.0% | −32.3R | −132.9R |
| EUR/USD | 413 | 31.2% | −27.9R | −182.8R |
| Gold | 399 | 36.8% | +42.8R | −89.9R |
| Bitcoin | 493 | 40.8% | +115.8R | −995.8R |
On bitcoin the median entry spread was 93% of the risk. Bitcoin trades around the clock, so the 9:30 New York range is only a chosen time there, and the cost tested is the Capital.com spread; exchange or futures fees were not tested.
2 numbers to check
Before you trust the backtest of a fast strategy, check how far away the stop is and how wide the spread is when you trade. If the spread is a big slice of the stop, the backtest is missing a big slice of the cost.
Reproduce it
- The script: ORB One-Candle Retest, Pine source, MPL-2.0. The defaults are the rules with the rejection-candle reading; the other two readings, the touch tolerance, the reward-to-risk ratio, a rounded target, a 12:00 exit and a coin-flip mode are optional research inputs. Commission and slippage are zero by default, and TradingView does not model the spread.
- Every trade: all-trades.csv lists every trade of the 46 registered runs: the 4 stocks with all 3 readings, each at the chart price, with the spread on its own side, and with the stop triggered by the opposite side, plus the 5 secondary markets at the chart price and with the spread. Each row has New York entry and exit times, direction, prices, the exit, the planned risk, the result in R and the spread at entry.
- The IDE in the video: PyneIDE, our IDE for Pine Script inside Visual Studio Code. It runs scripts locally on PyneCore, the open-source Pine runtime; the spread setting is a PyneCore feature that TradingView doesn’t have.
Data and assumptions. The main test uses Capital.com share CFDs for AMD, Tesla, Apple and Nvidia, 1-minute candles from January 2, 2024 to November 11, 2026, with the bid and the ask side of every candle; the chart price is the bid. Days with a missing range candle are skipped (AMD 2, Tesla 1, Apple 1, Nvidia 0). The exchange cross-check uses TradingView 1-minute exchange prices with 1 tick of slippage; its file for AMD ends on November 6. R is the result divided by the distance from the signal candle’s close to the stop. The “with the spread” figures fill buys at the ask and sells at the bid and trigger every order on its own side; no commission is added, which matches Capital.com’s share CFD pricing, and the trades end by 11:00, so no overnight funding applies. When a candle touches both the stop and the target, the backtest follows TradingView’s assumption about the order inside the candle; this happened on 13 of 1,463 trades. Closing at 12:00 instead of 11:00 gives 33.8% and +25.6R; rounding the target out to a whole price gives 25.8% and +23.0R. The $1,000 accounts are simulated from the backtest trades (1% of current equity at risk, fractional units, position value capped at 3 times equity); because the stops are so tight, the cap often decides the size, and the median real risk per trade was 0.40–0.77%. They are an illustration, not a registered test: the plan registered one shared account without leverage, which made the share price decide the size, and we replaced it before reporting. The 3 retest readings, the touch tolerance and the trading window are our definitions of the video’s discretionary method, not the creator’s exact process. The split of the coin’s trades by direction is exploratory.
If you get a different result, include the symbol, dates, settings and costs so we can compare the experiments.