
Myth Busting · Episode 04
The "Sneaky Pivot" Strategy, Tested: No Better Than a Coin Flip
TL;DR: A video with 2.6 million views promises a strategy that needs one candle and 15 minutes a day. In code it needs 3 candles, enters 30 minutes after the open at the earliest, and the typical trade stays open until the close. On the Dow and 7 US stocks, January 2024 to October 2026, the rules made +33.6R over 1,174 trades before costs, 0.029R per trade. Random directions on the same days did better 13.5% of the time, and a cost of 5 basis points per round trip turns the result into −42.4R. Script, data notes and every run are below.
The claim
The video is The Rumers’ How Trading Like an Idiot Makes Me $10,000/Month (15 Minutes a Day), published May 24, 2026. Its opening promise: one time frame, one candlestick, and 15 minutes of your time. The strategy it teaches is called the Sneaky Pivot.
We test trading claims the same way every time: write the rules down before any test, turn them into code, run them on fixed data and keep every result. For this episode the test plan was registered on October 25, 2026, before a single strategy run, and its SHA-256 hash was recorded.
The rules
Four lines are drawn every day. The range levels are yesterday’s regular-session high and low. The swing levels sit further out: looking left from yesterday, the next higher high above the range high and the next lower low below the range low. The upper two lines are only for selling, the lower two only for buying.
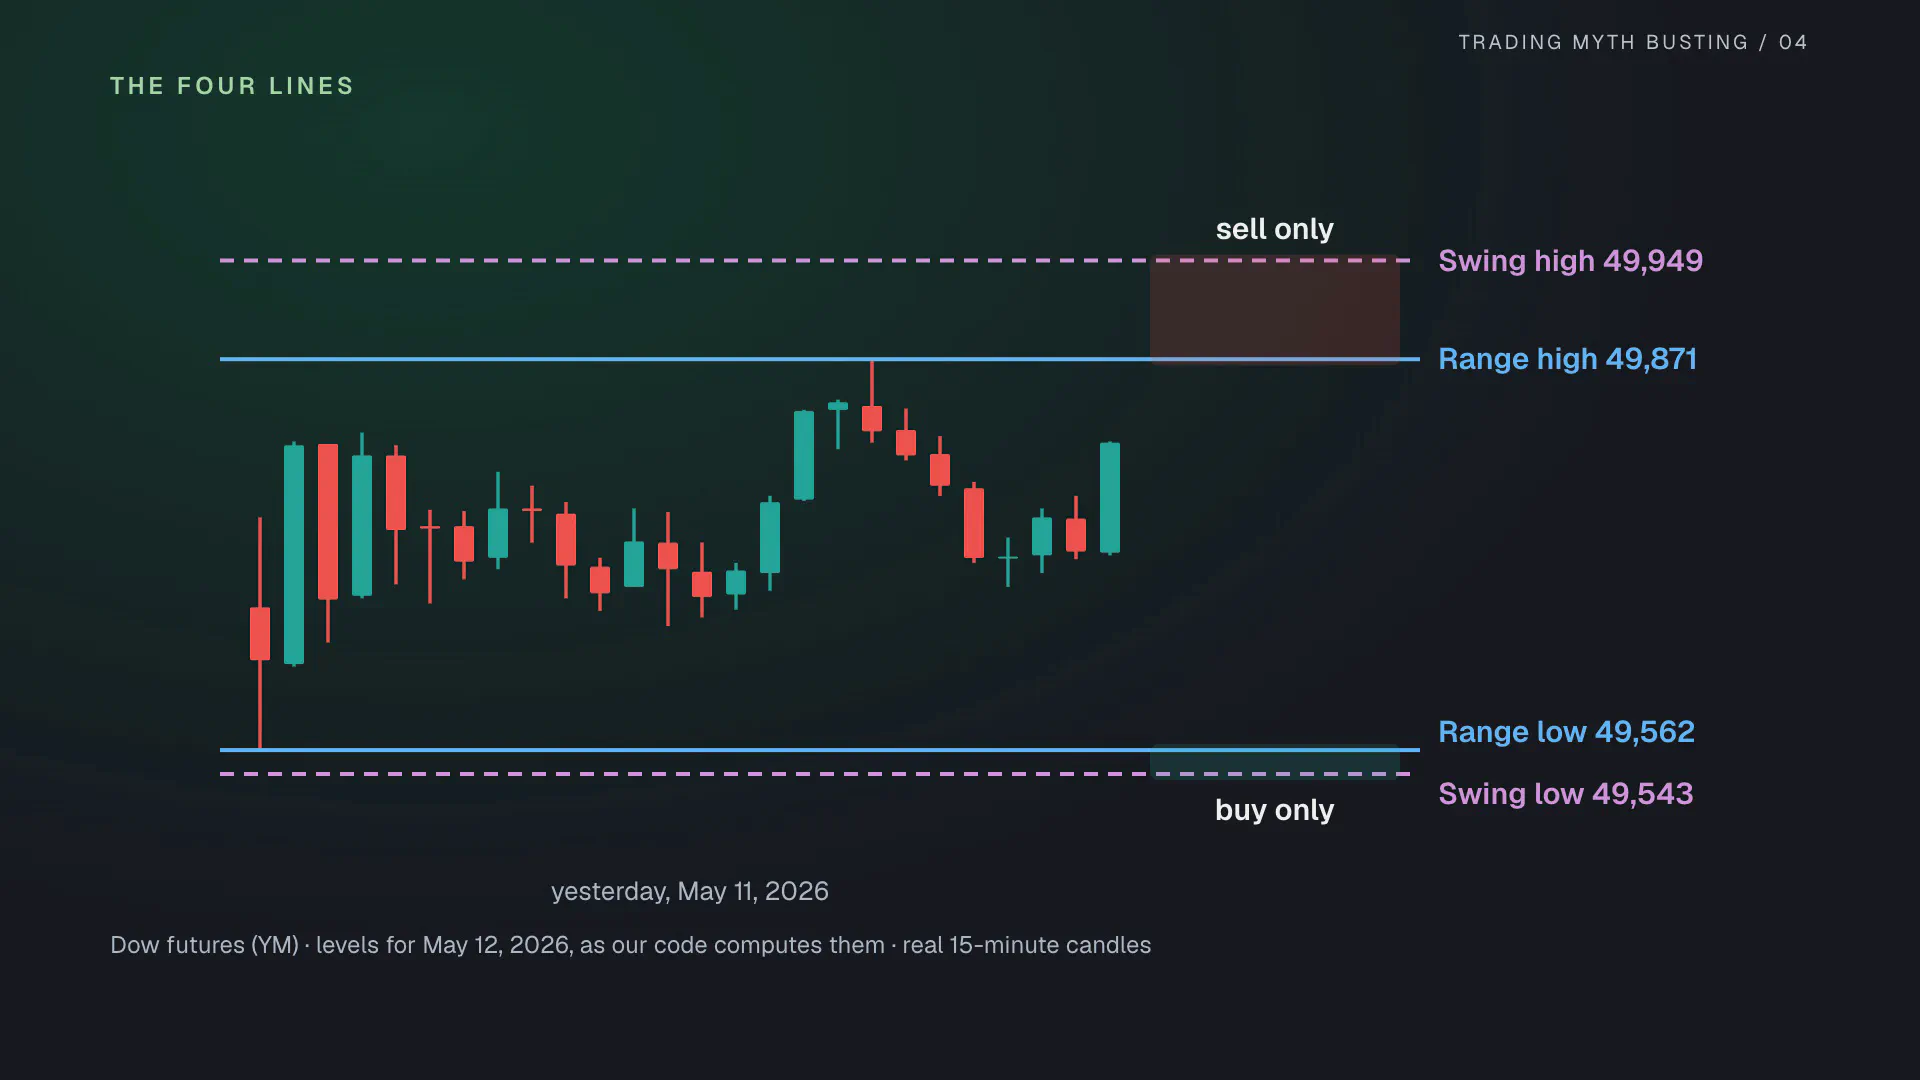
Then come 3 candles of 15 minutes:
- The first candle of the New York session has to reach a line.
- The second one, the “sneaky” candle, has to turn the other way.
- The entry comes when price breaks the sneaky candle. The stop goes beyond the low (for a long), and the target is the other side of the range.
In the script the first two steps are a few lines:
bool reachesLow = low <= rangeLow + tolerance
bool reachesHigh = high >= rangeHigh - tolerance
side := reachesLow and not reachesHigh ? 1 : reachesHigh and not reachesLow ? -1 : 0
and the default entry is a stop order one tick beyond the sneaky candle, valid for one candle:
if entryMode == "Break" and usable(breakLevel)
    entryLevel := breakLevel
    strategy.entry("Entry", isLong ? strategy.long : strategy.short, stop=entryLevel)
The video leaves some details open, so the plan fixes them: times are New York time, the session is 09:30 to 16:00, the sneaky candle is the 09:45 candle, a candle that reaches both sides is skipped, there is at most one trade per day, and a position still open at the close is closed there.
Checking the code against the video
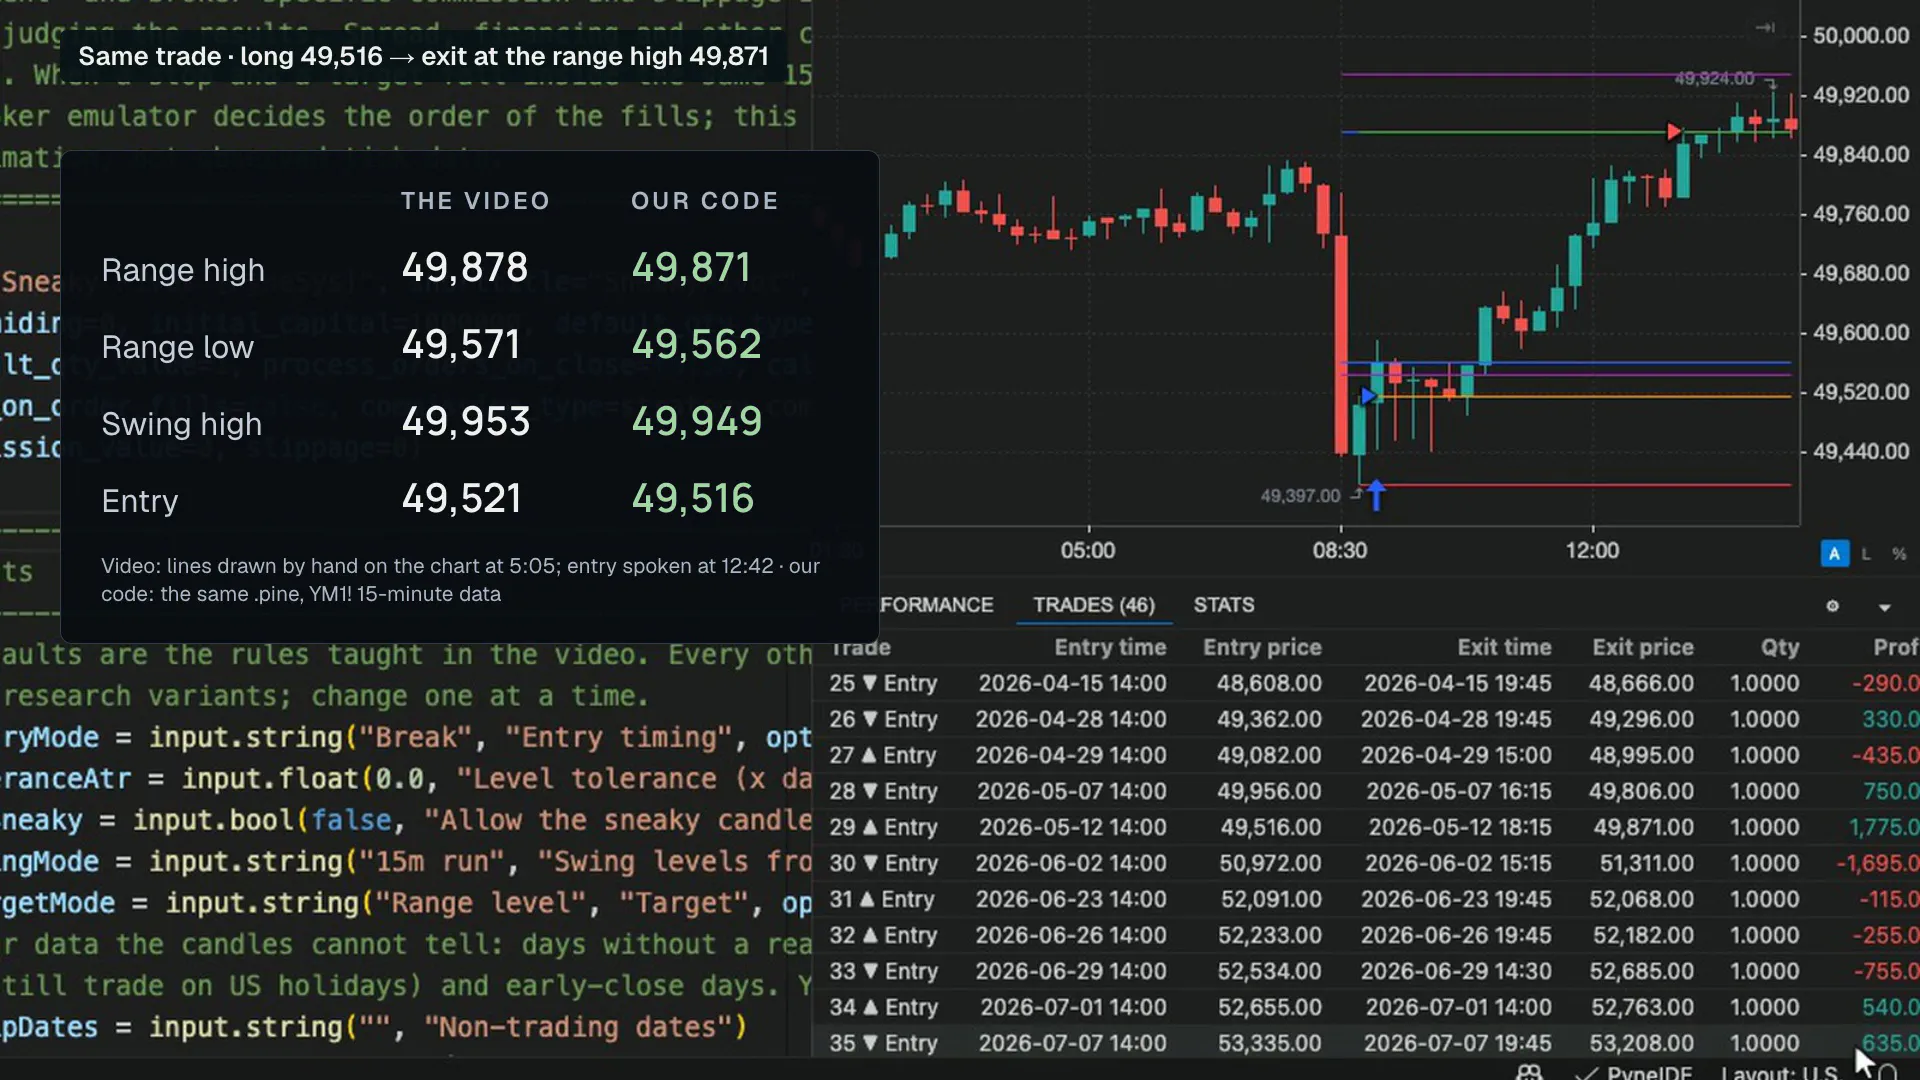
The creator’s teaching example is the Dow futures on May 12, 2026. Our code finds the same day and the same trade:
| Level | The video | Our code |
|---|---|---|
| Range high | 49,878 | 49,871 |
| Range low | 49,571 | 49,562 |
| Swing high | 49,953 | 49,949 |
| Entry | 49,521 | 49,516 |
The video’s levels are lines drawn by hand on the chart (5:05), and its entry is spoken (12:42). The code’s levels come from the same 15-minute data feed (YM1!). The trade is the same: a long, exiting at the top of the range, 49,871.
The live trade
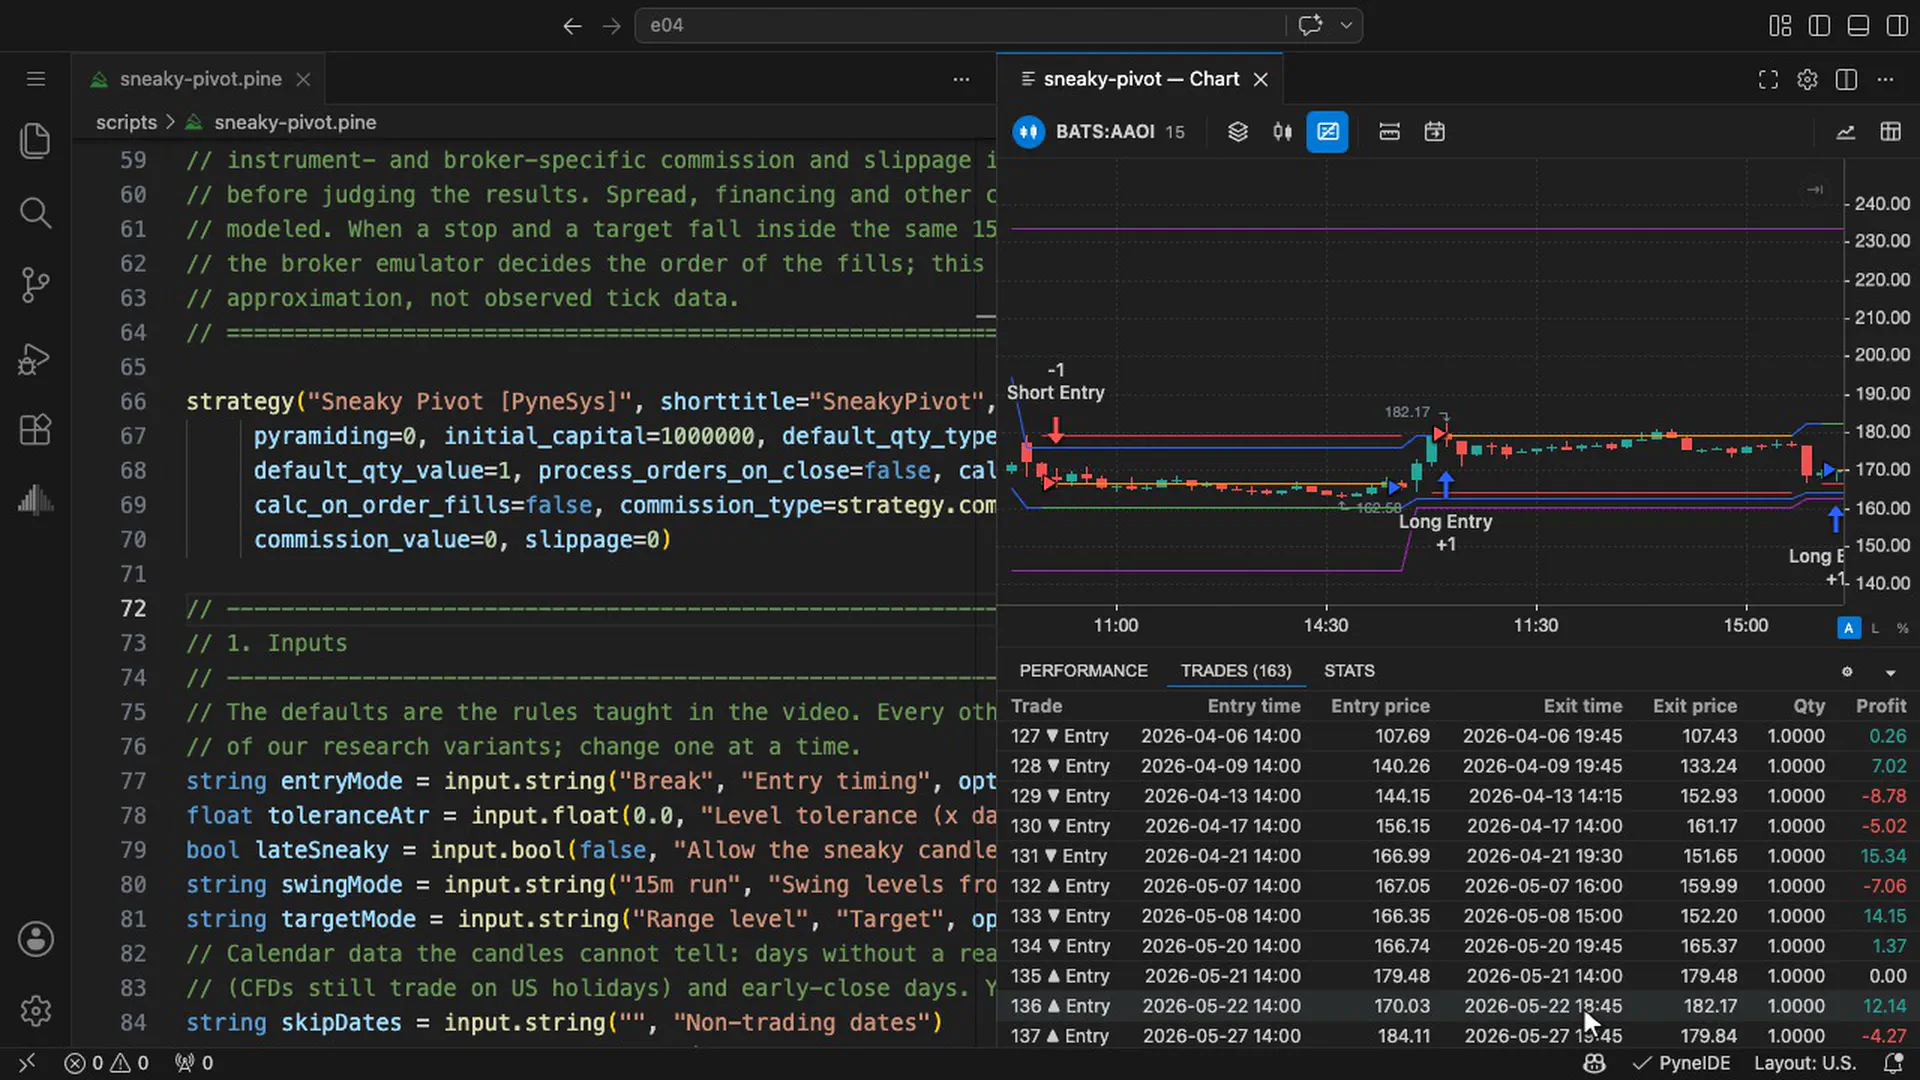
The video also trades live. On May 22, 2026, it buys Applied Optoelectronics (AAOI). The rule says: only buy at the line. The first candle turned $2.66 above the range low. The video says so itself: “it didn’t quite make it there, but it was close enough for me.” The second live trade, a leveraged Google ETF (GGLL), also stopped short of its line, by $0.79.
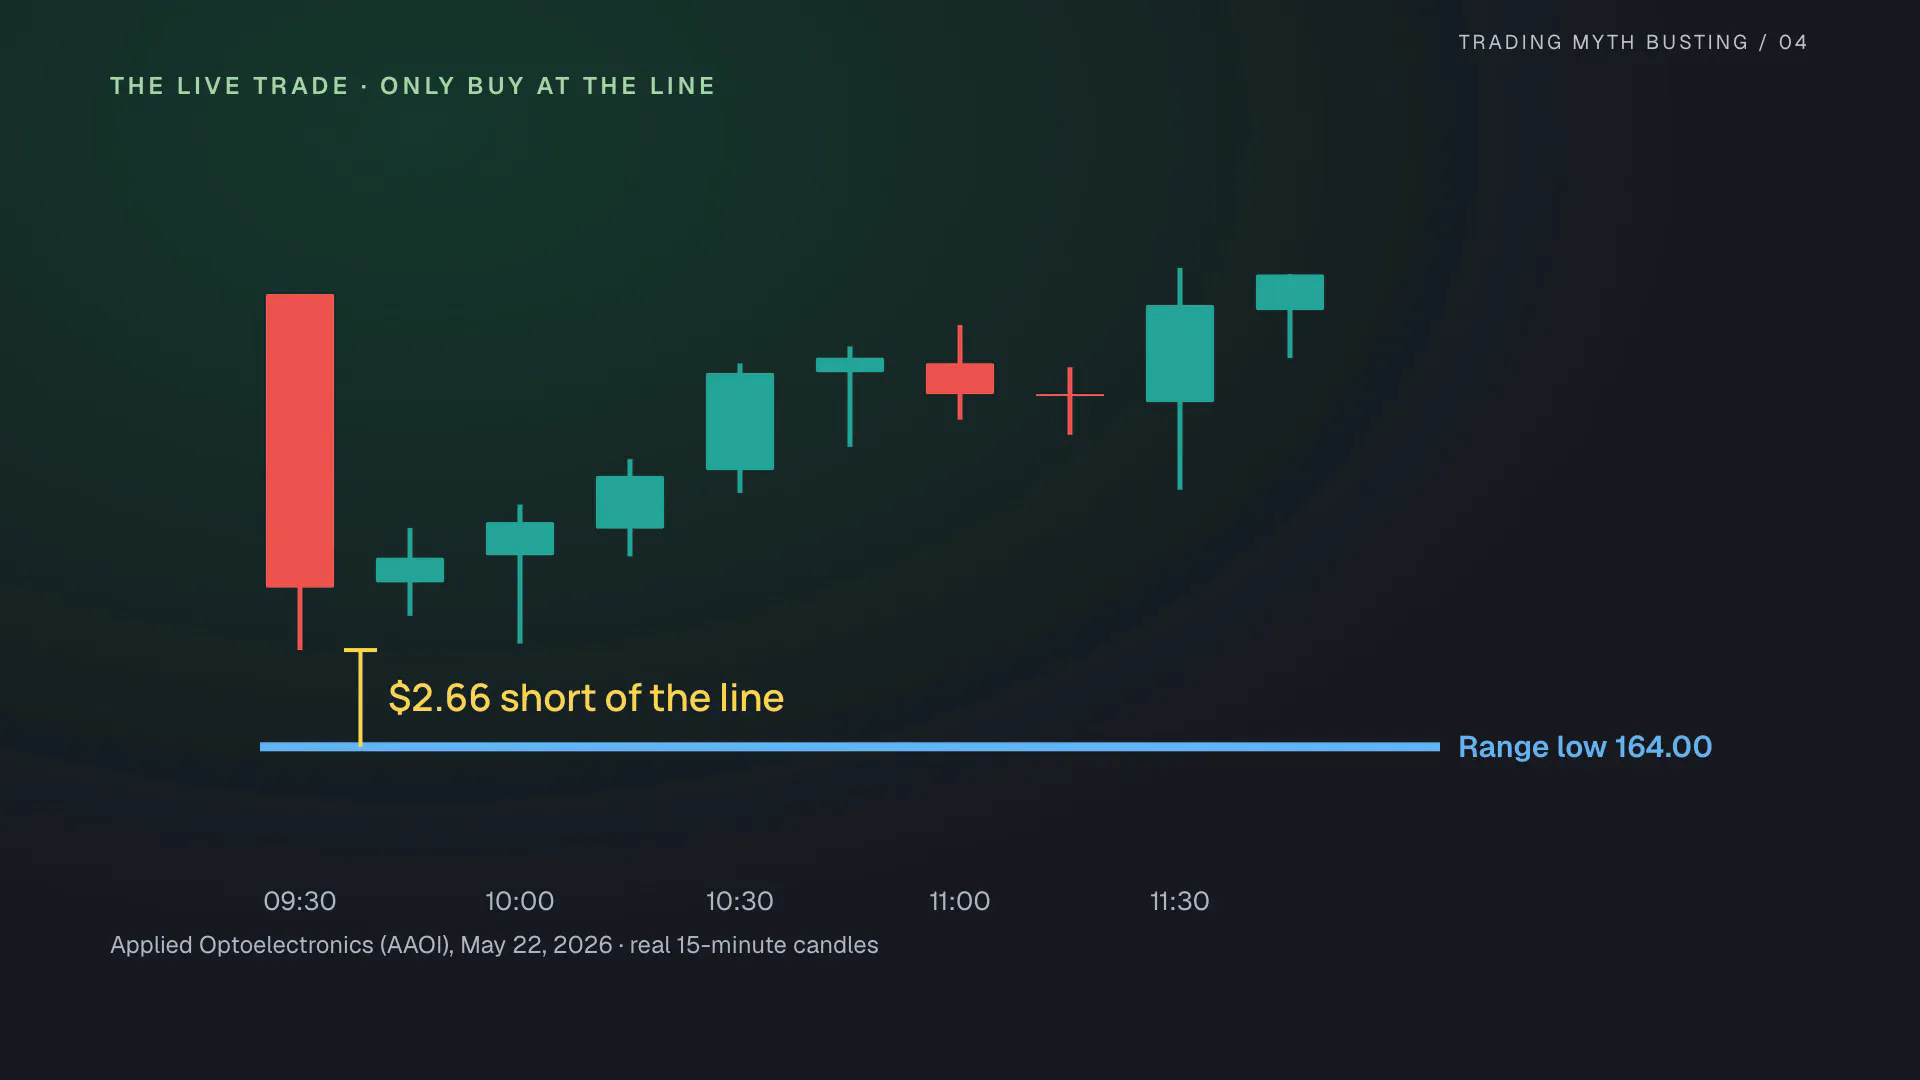
“Close enough” is never defined, so we turned the exception into a rule: a level tolerance, measured in multiples of the daily average true range. At a tenth of a day’s range there is still no trade on May 22. At a quarter, the code takes a long at 170.03 and exits at the target, 182.17. We tested both versions: the rule the video teaches, and the rule it actually trades.
“Almost every single time”
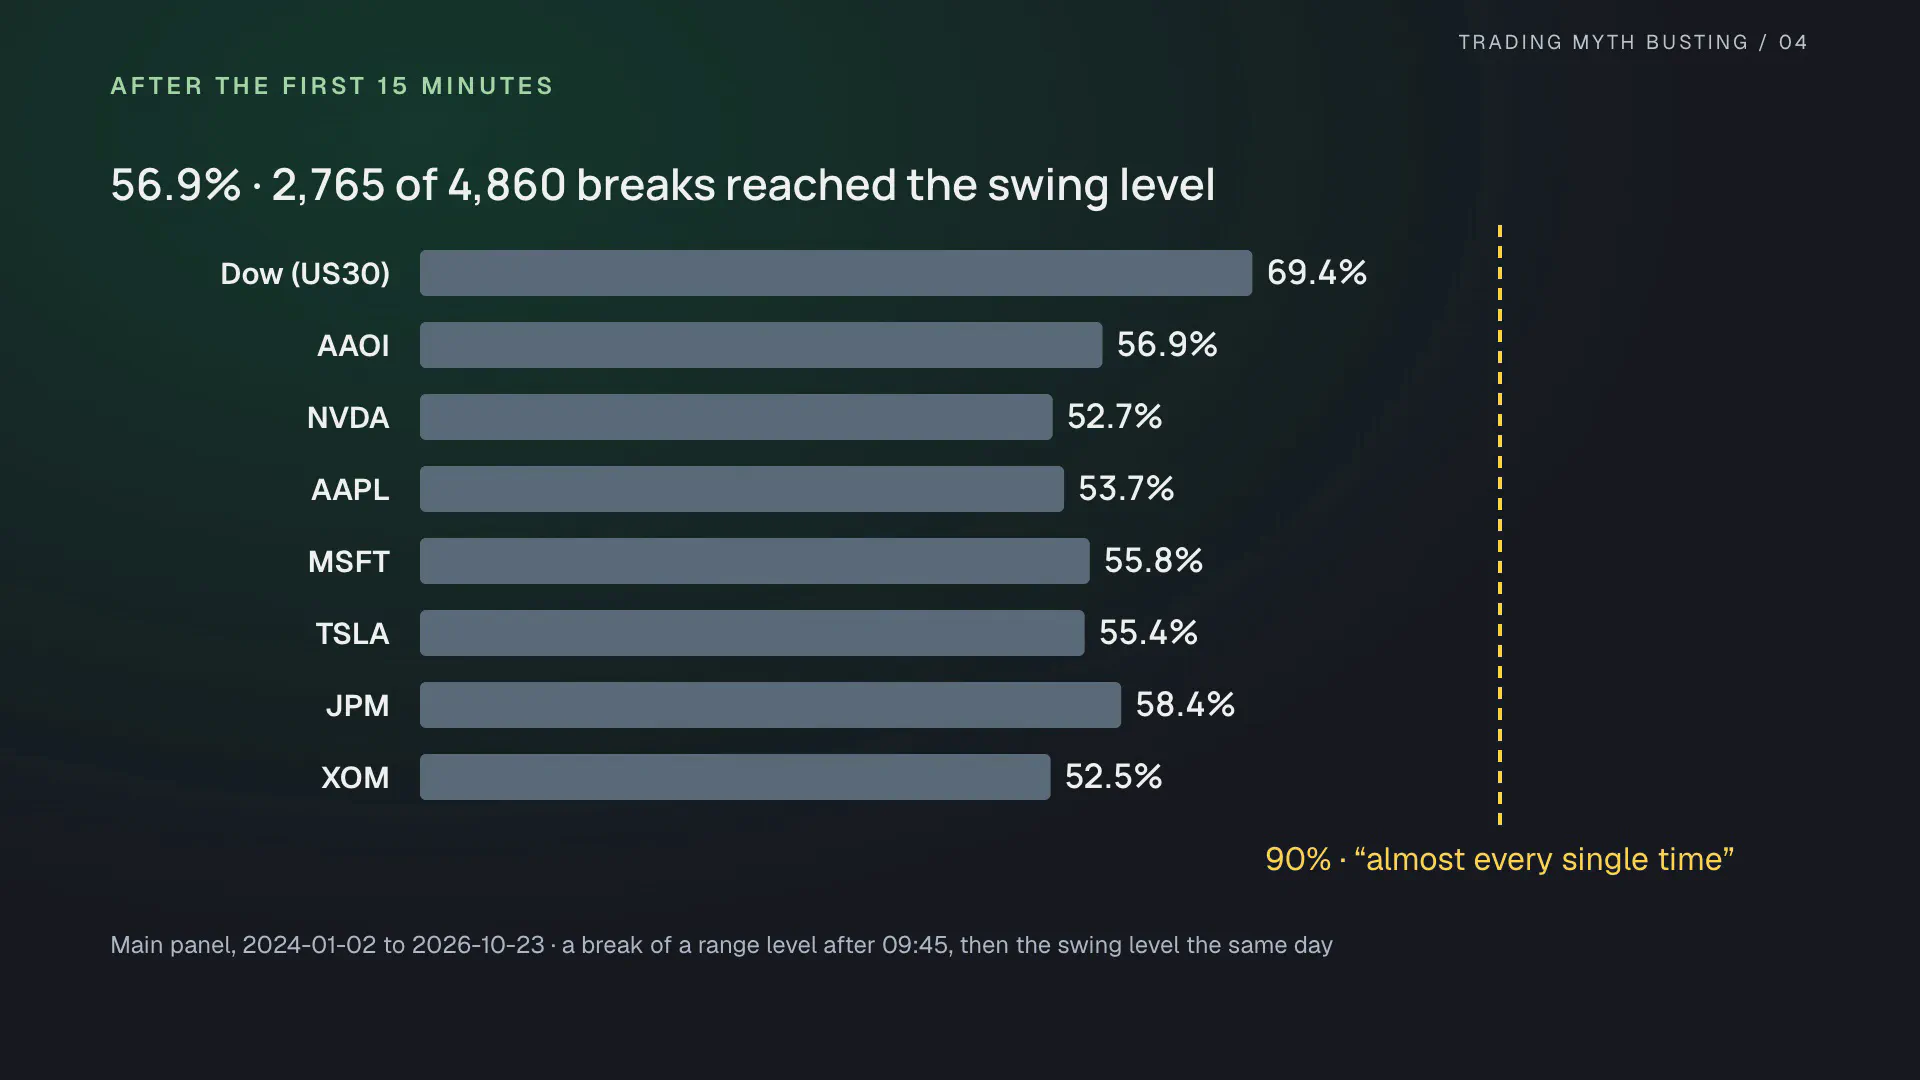
Every target rests on one claim: after the first 15 minutes, when price breaks a range level, it reaches the swing level almost every single time. Across the main panel (the Dow and 7 stocks, almost 3 years) that happened in 2,765 of 4,860 breaks: 56.9%. The highest market, the Dow, reached 69.4%. No market reached 90%.
The full strategy
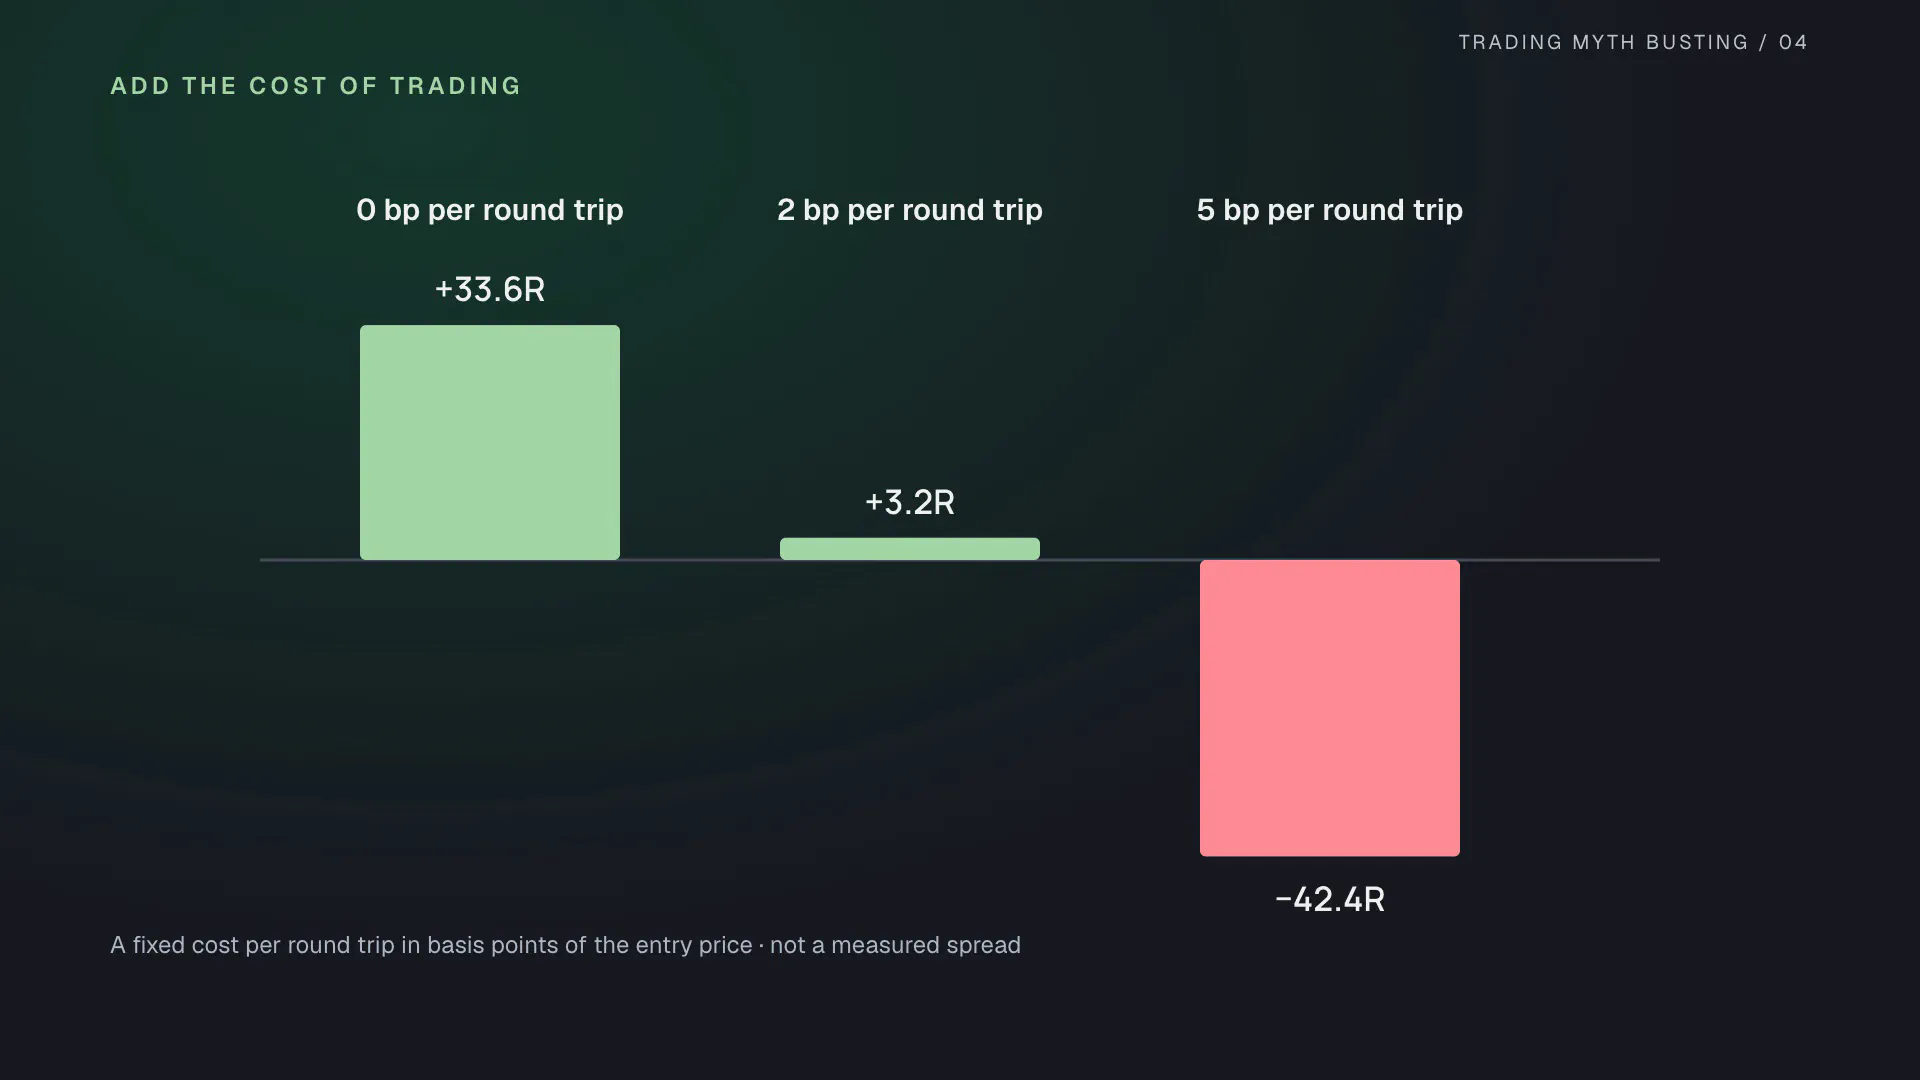
On the main panel the rules as taught produce 1,174 trades. Before costs they made +33.6R. R is the result divided by the initial risk, so that is 0.029R per trade: about 3 cents back for every dollar risked.
That margin does not survive the cost of trading. With a fixed cost of 2 basis points per round trip, +3.2R is left; at 5 basis points it is −42.4R.
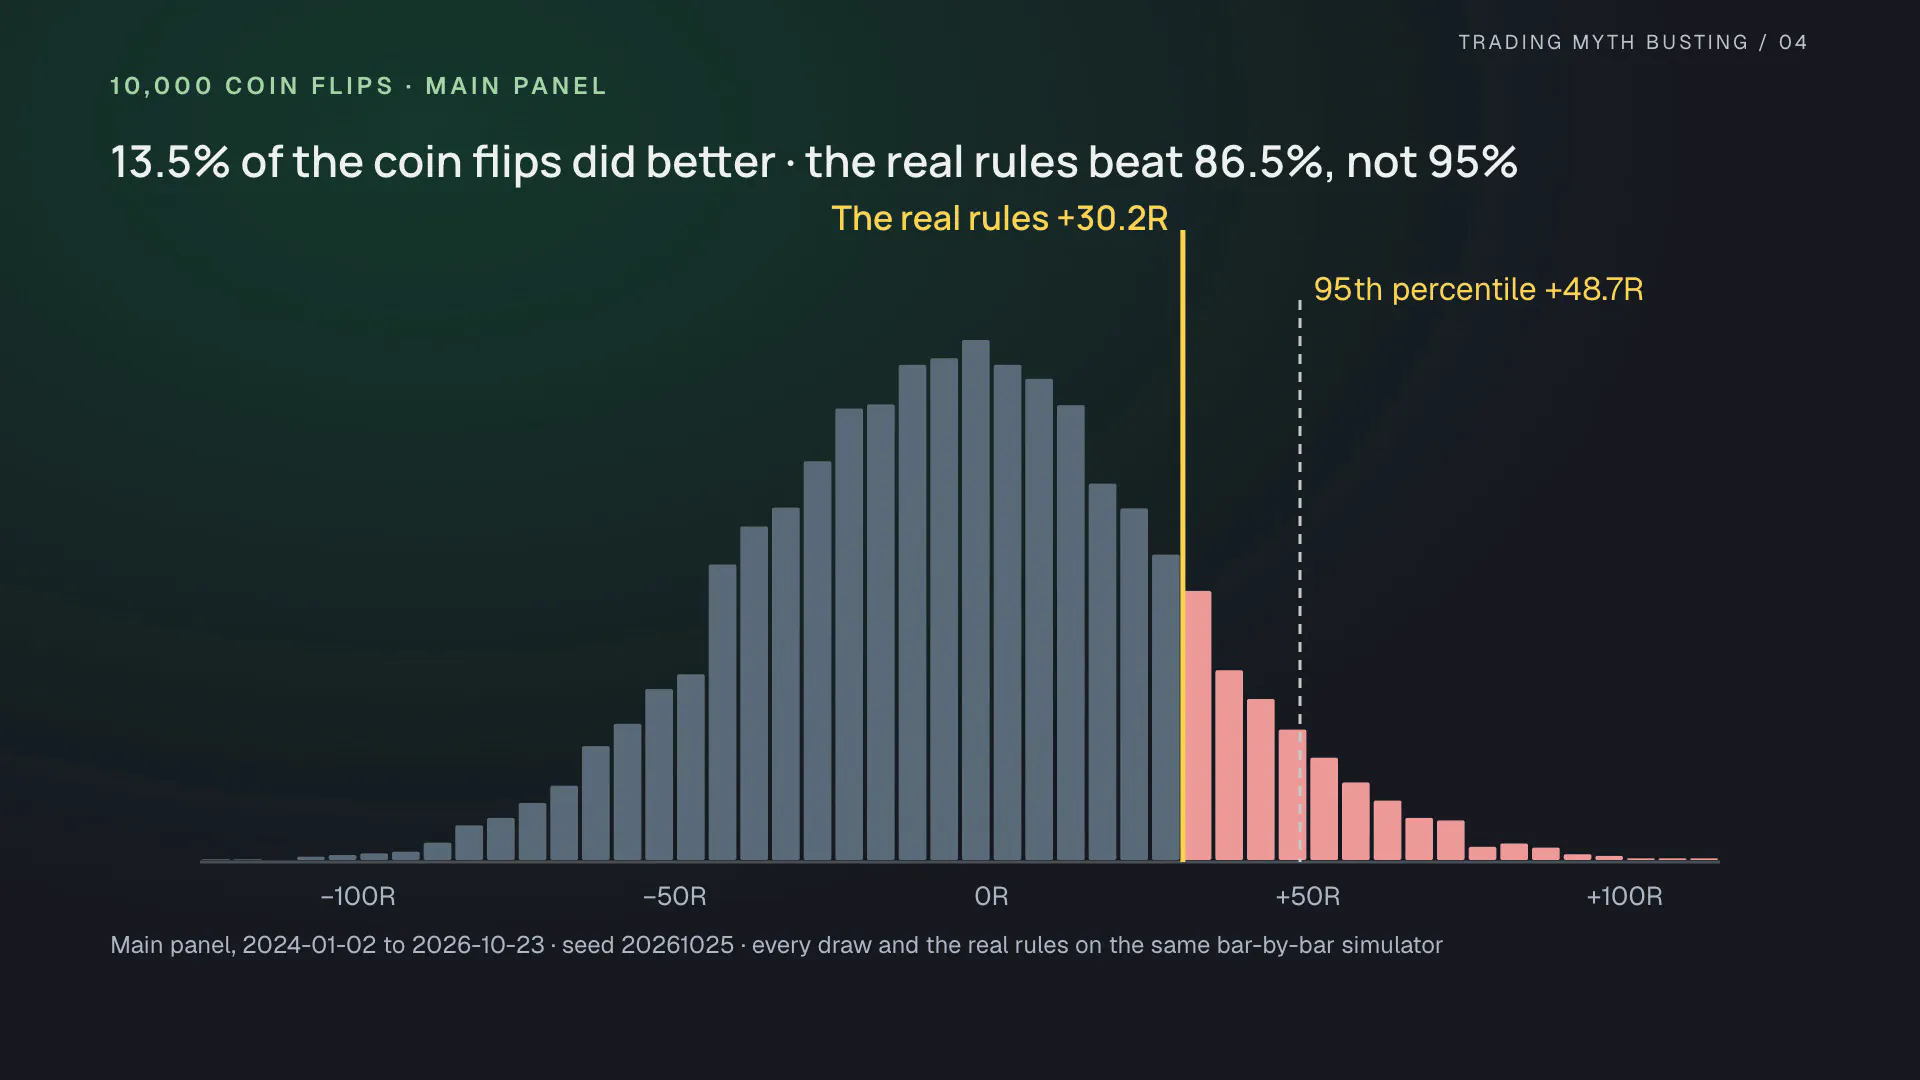
Then the hardest test. Keep the same days, the same entry times and the same stop and target distances, but choose the direction by a coin flip. We ran that 10,000 times on the same bar-by-bar simulator. The real rules came out at +30.2R in that simulator; 13.5% of the coin flips did better. The real rules beat 86.5% of random directions, short of the 95% our plan required to call it an edge.
“Early, late, on the close or halfway”
In the comments the creator adds that you could get in early, late, on the candle close or halfway, and both examples still would have won. On those 2 days he is right: on the Dow all 5 entries reach the target, and on AAOI, with the tolerance the live trade needs, all 5 win as well.
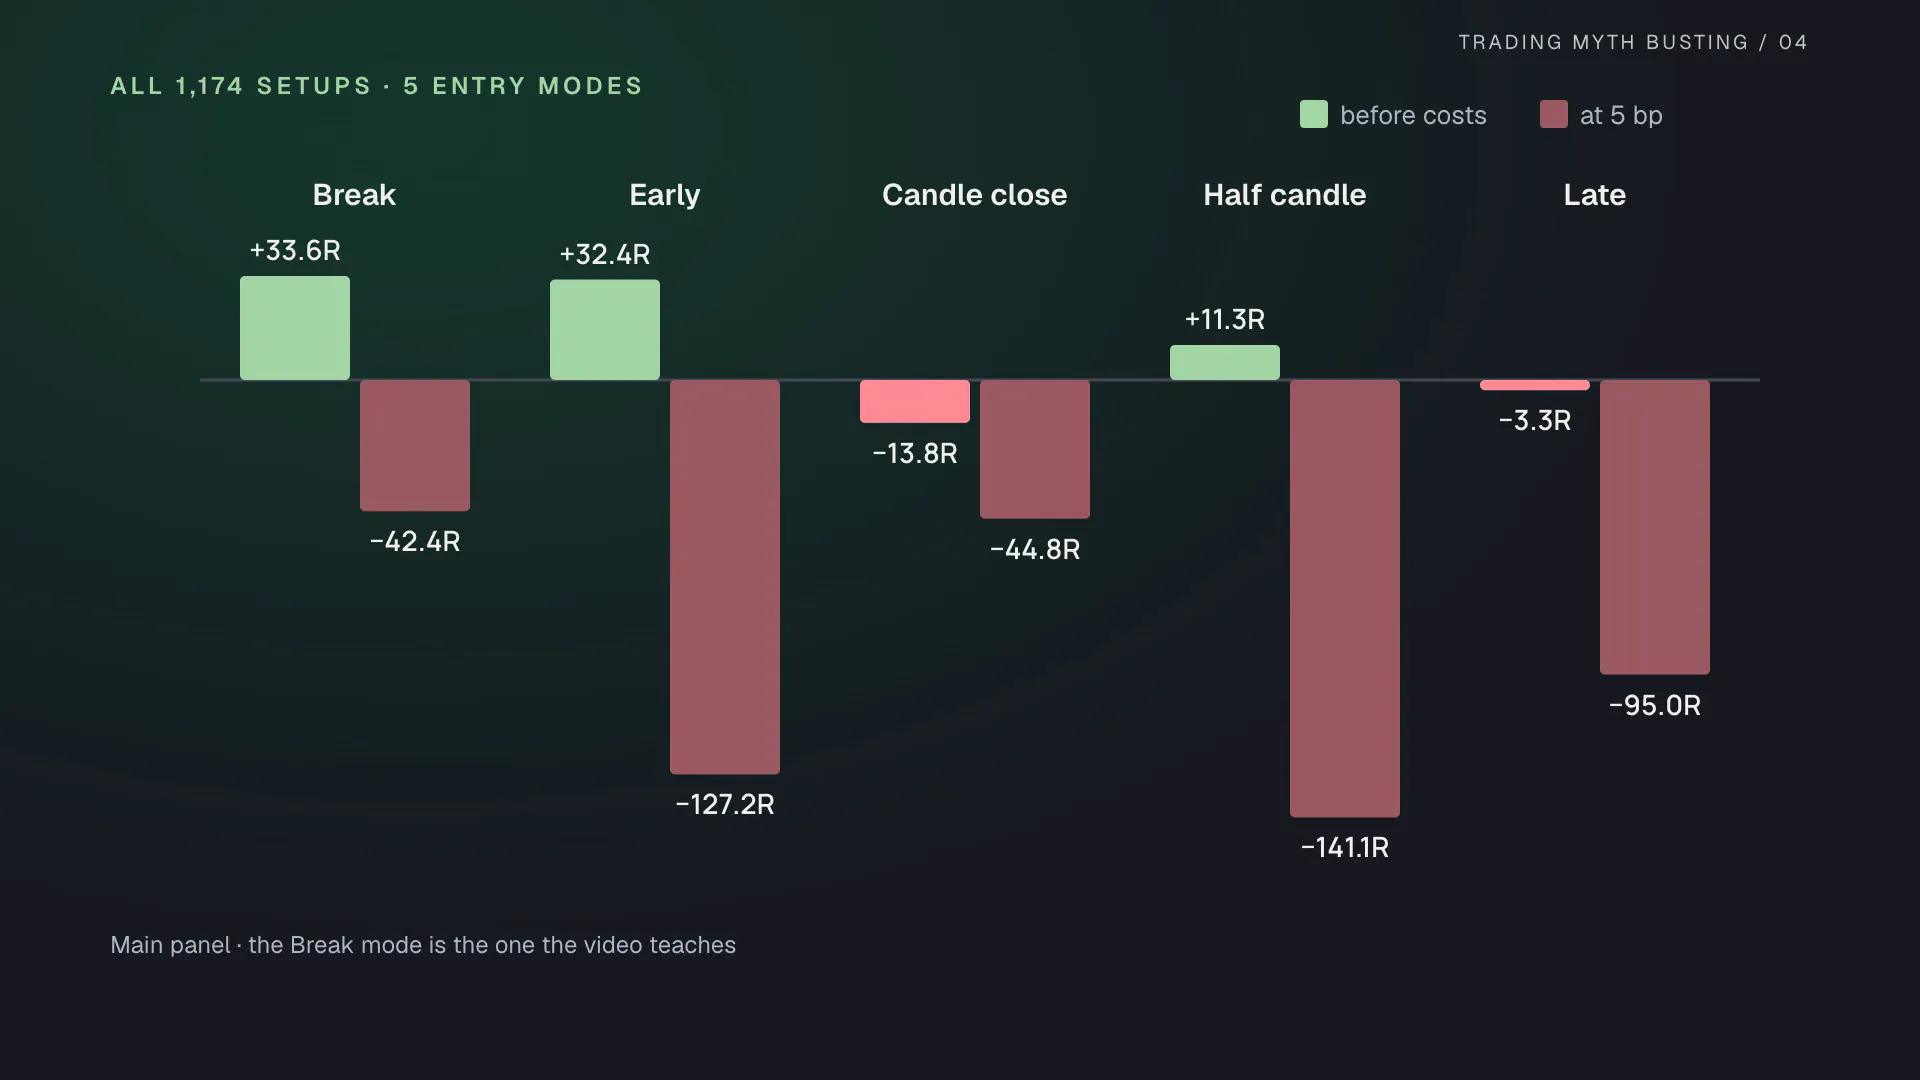
Across all 1,174 setups the picture changes:
| Entry | Trades | Hit rate | Before costs | At 2 bp | At 5 bp |
|---|---|---|---|---|---|
| Break (video) | 1,174 | 48.0% | +33.6R | +3.2R | −42.4R |
| Early | 1,782 | 42.9% | +32.4R | −31.4R | −127.2R |
| Candle close | 615 | 49.9% | −13.8R | −26.2R | −44.8R |
| Half candle | 1,263 | 36.8% | +11.3R | −49.7R | −141.1R |
| Late | 1,152 | 46.3% | −3.3R | −40.0R | −95.0R |
Two of the 5 entries lose money before any costs. At 5 basis points, all 5 do.
Any market, 15 minutes a day
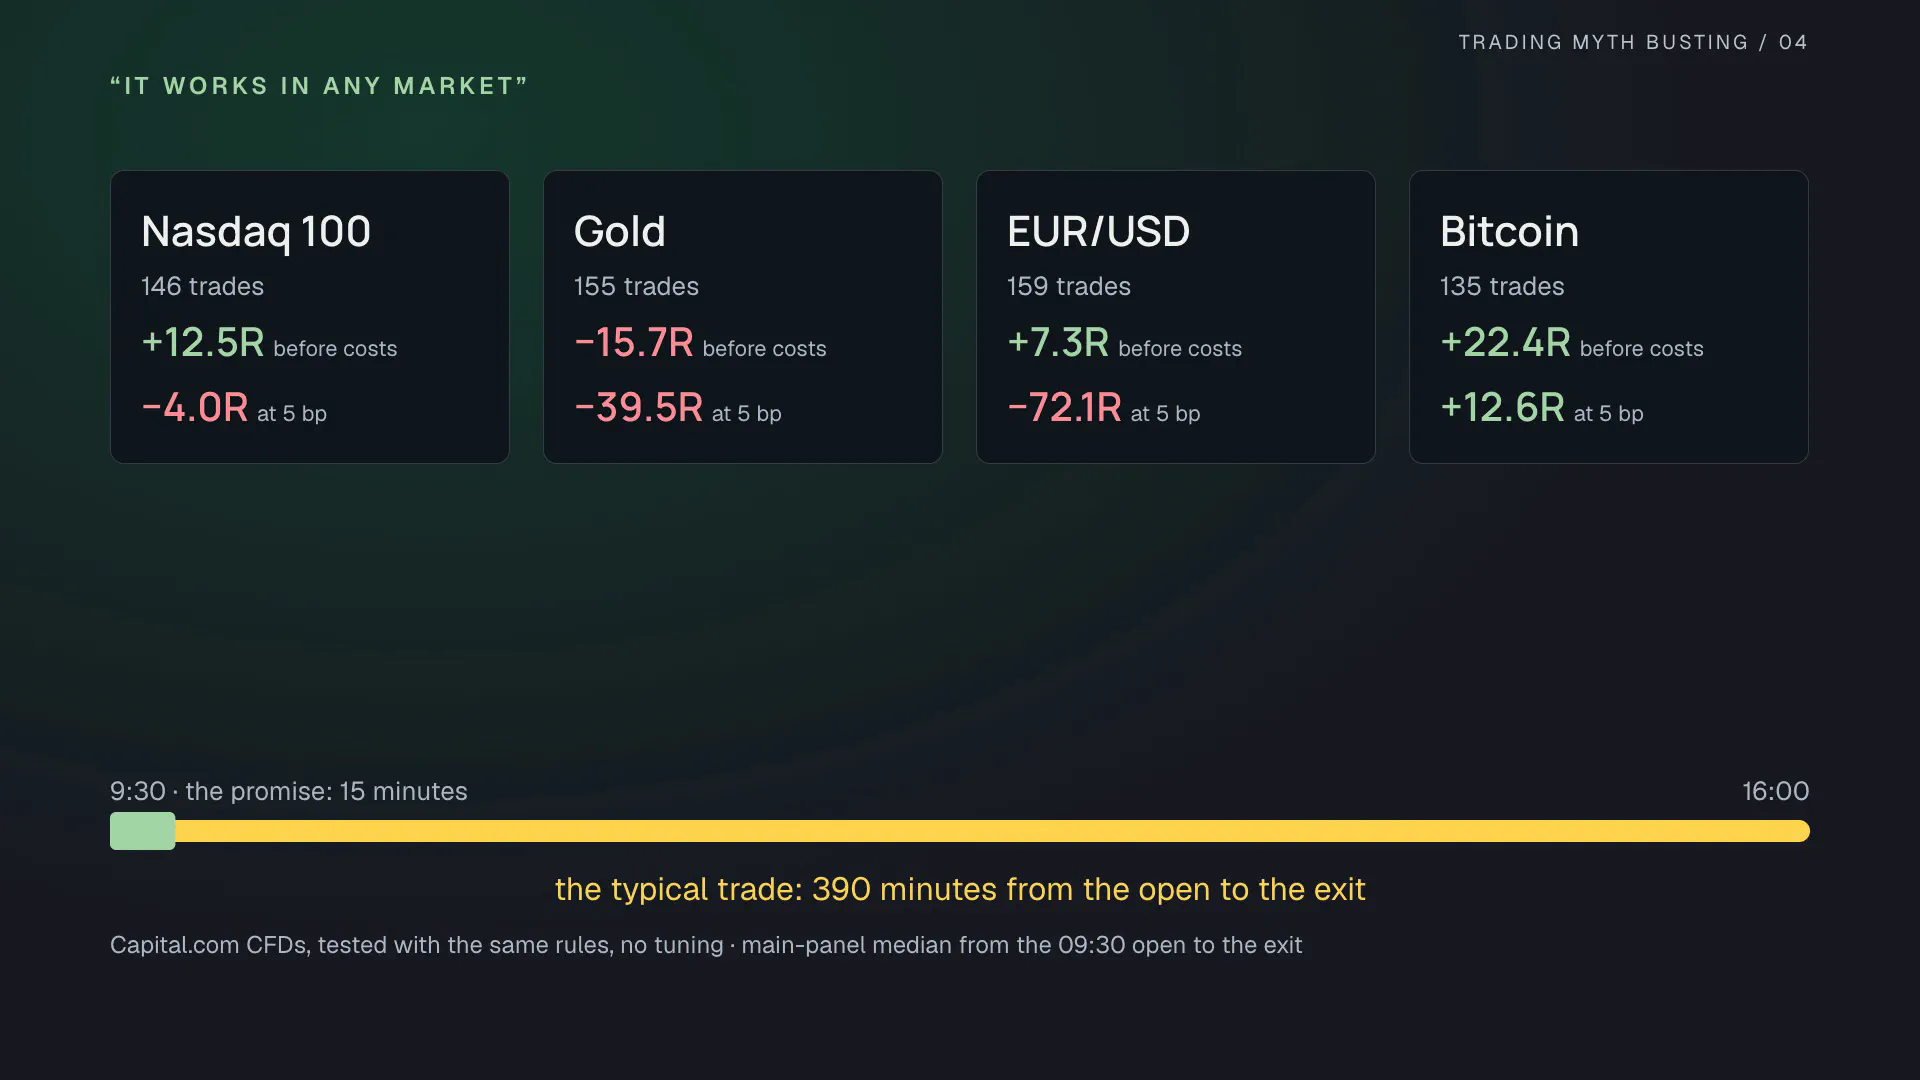
“It works in any market,” the video says. We added 4 more, with the same rules and no tuning:
| Market | Trades | Before costs | At 5 bp |
|---|---|---|---|
| Nasdaq 100 | 146 | +12.5R | −4.0R |
| Gold | 155 | −15.7R | −39.5R |
| EUR/USD | 159 | +7.3R | −72.1R |
| Bitcoin | 135 | +22.4R | +12.6R |
Gold lost before costs, and only bitcoin survived 5 basis points. On EUR/USD the small stops make a fixed basis-point cost especially heavy; a measured spread would be the fairer model there.
As for 15 minutes a day: the earliest entry is 30 minutes after the open, and on the main panel the median time from the open to the exit is 390 minutes, the whole session. Half the trades are still open at the close.
What the test supports
Is this a bad strategy? That is not what the numbers say. They say the rules in the video are no better than a coin flip, and they lose once you pay to trade. The split by time points the same way: before the video was published the main panel made +36.8R before costs over 989 trades; after it, −3.3R over 185 trades.
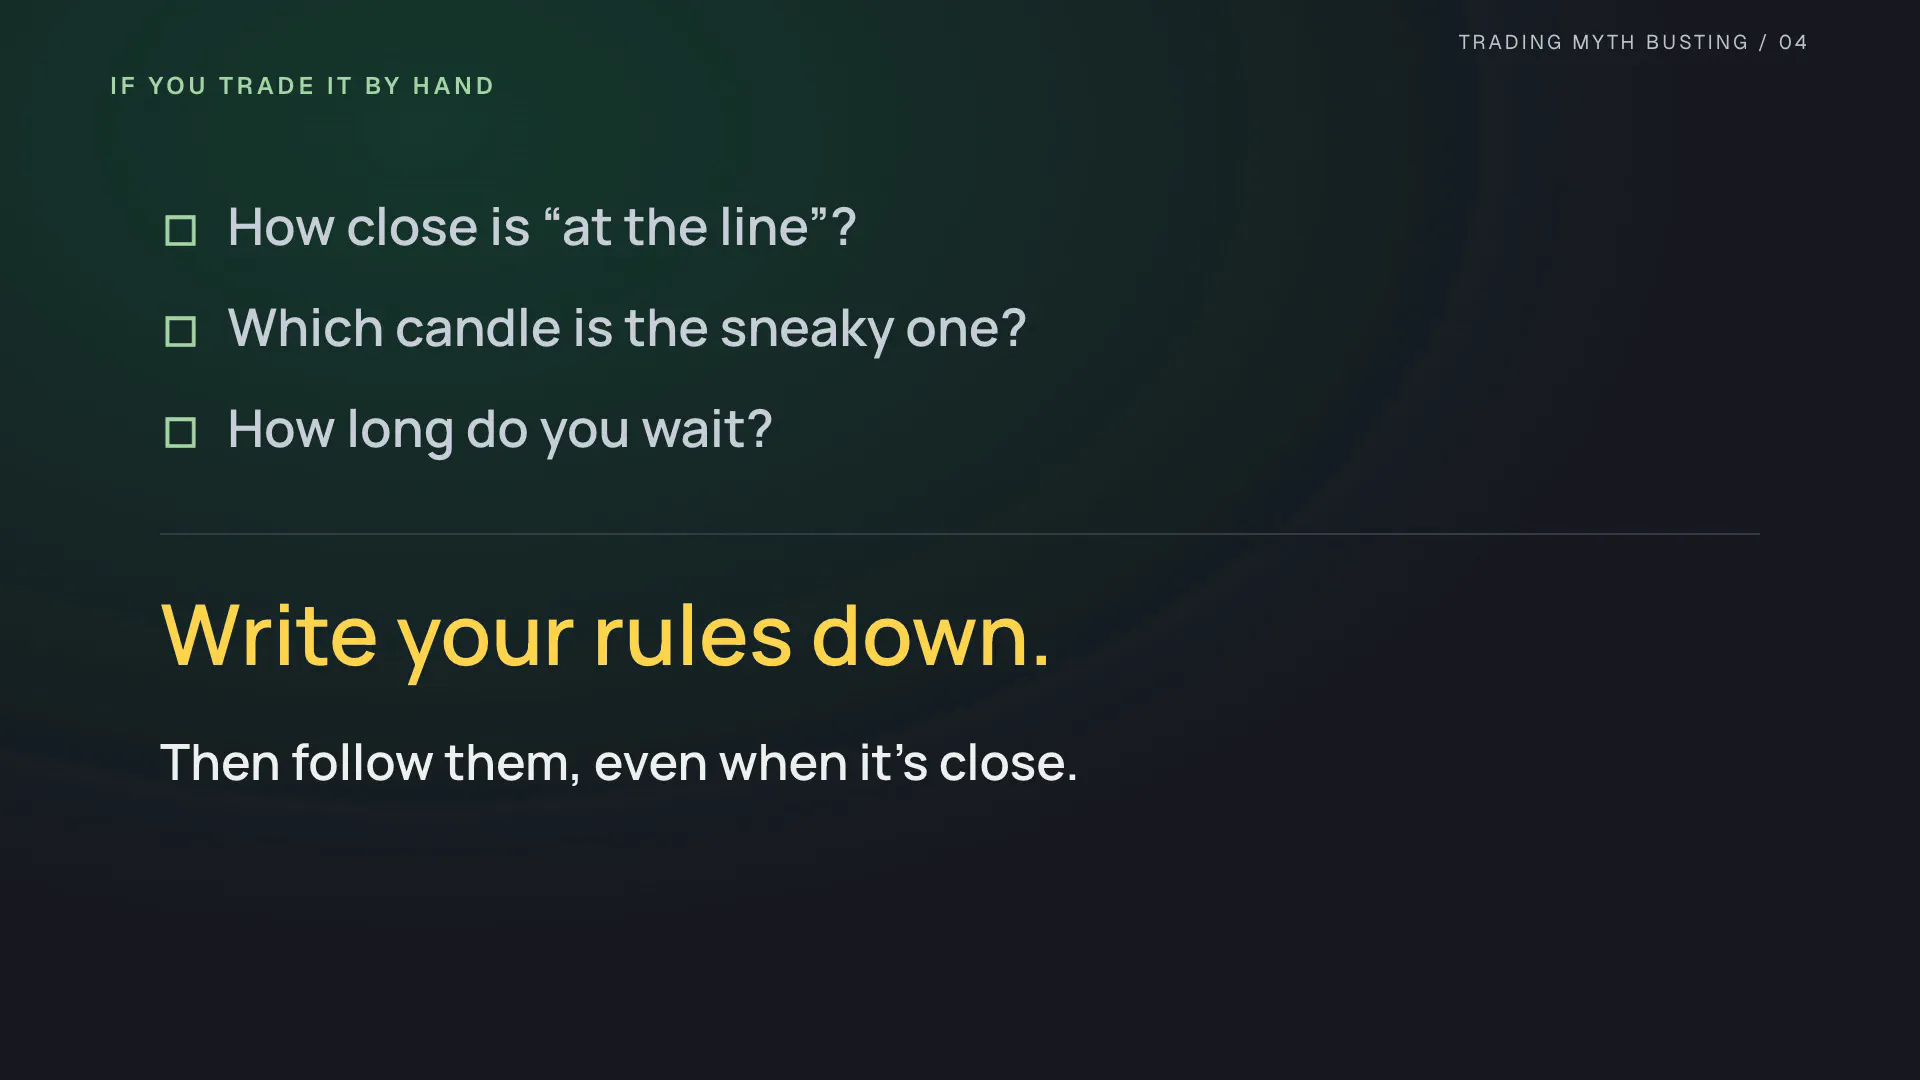
The code is not the point either. Code just cannot fudge: it has to know exactly how close counts as “at the line”, which candle is the sneaky one, and how long to wait. If you trade the setup by hand, you need the same answers, and you need them before the candle closes, not after. Otherwise every winner counts, and every loser was not a real setup.
Reproduce it
- The script: Sneaky Pivot Research, Pine source, MPL-2.0. The defaults are the rules as taught; the entry timing, the level tolerance, a later sneaky candle, daily swing levels and a swing target are optional research inputs.
- Every run: all-results.csv lists all 140 runs (14 markets × 10 variants) with their trade counts, hit, stop and target rates, median holding time, and R before costs and at 2, 5 and 10 basis points, for the whole period and before and after the video’s publication.
- The IDE in the video: PyneIDE, our IDE for Pine Script inside Visual Studio Code. It runs scripts locally on PyneCore, the open-source Pine runtime.
Data and assumptions. January 2, 2024 – October 23, 2026, standard 15-minute candles. The Dow (US30 CFD) and the four additional markets come from Capital.com; the 7 stocks (AAOI, NVDA, AAPL, MSFT, TSLA, JPM, XOM) and GGLL from TradingView’s regular-session data, so their swing levels use regular-session candles only. The Dow futures cross-check (YM1!) covers December 2025 onward. R is measured from the actual entry to the initial stop, with one unit per trade; the totals are rule tests per market, not a portfolio return. The 2, 5 and 10 basis-point round-trip costs are scenarios deducted from the fills, not measured broker costs; spreads, financing and funding are not modeled. The coin-flip test uses our own bar-by-bar simulator, which counts the stop first when a candle touches both stop and target. It matches the PyneCore result within 0.1R on 11 of the 14 markets and comes out lower on the other 3, and the real rules are compared on that same simulator. The sneaky candle, the level tolerance, the swing scan and the session-close exit are our definitions of a discretionary method, not the creator’s exact process.
If you get a different result, include the symbol, dates, settings and costs so we can compare the experiments.