
Myth Busting · Episode 07
The "70% Win Rate at 1:1" Two-Candle Strategy, Tested: 16 Trades, 4 Win Rates, and a Coin Flip
TL;DR: An IQCapital interview with more than 200,000 views says Harry Sharpe’s New York open strategy wins more than 70% of the time, mostly with a target as big as the stop. At 1:1 the break-even win rate is 50%, so 70% would be +0.4R per trade before costs. We coded the rules and ran them on Capital.com Nasdaq 100 5-minute candles from January 2024 to November 2026, 742 trading days. The 2 candles that set the direction called the session right 47.7% of the time; buying every day on the same days was right 48.8%. The full rule traded on only 16 days. With a fixed 1:1 target, 10 of the 16 won: 62.5%, or 81.2% if the 3 break-even trades count as wins. With his own break-even management, 43.8% won, or 75.0%, and that version earned more: +5.4R against +4.3R. 16 trades can’t prove or disprove 70%, and against 200 coin flips the strategy beat 91%, short of the 95% bar we set before the test. Script, every trade and the data notes are below.
The claim
The video is IQCapital’s This Strategy Wins 70% of the Time. He Proved It Live for 3 Years., an interview with Harry Sharpe published November 6, 2026. He trades the Nasdaq at the New York open, one hour a day. The claim is clear: “I have a 70 plus% win rate” (0:00), “mostly one to ones” (28:53).
The interview does a lot right. Harry Sharpe is open about which part of his trading is judgment (“It’s a little bit experience based”, 48:52). He always trades with a stop. He gives a number for a breakout candle that is too big. And the indicator he uses for his bias is free and open source: Tradesharpe Session Bias by TradeSharpe99, under MPL-2.0.
We test the rules, not his personal trading or his track record. We test trading claims the same way every time: write the rules down before any test, turn them into code, run them on fixed data and keep every result. The script is published, so anyone can run it and check every number.
What 70% at 1:1 has to beat
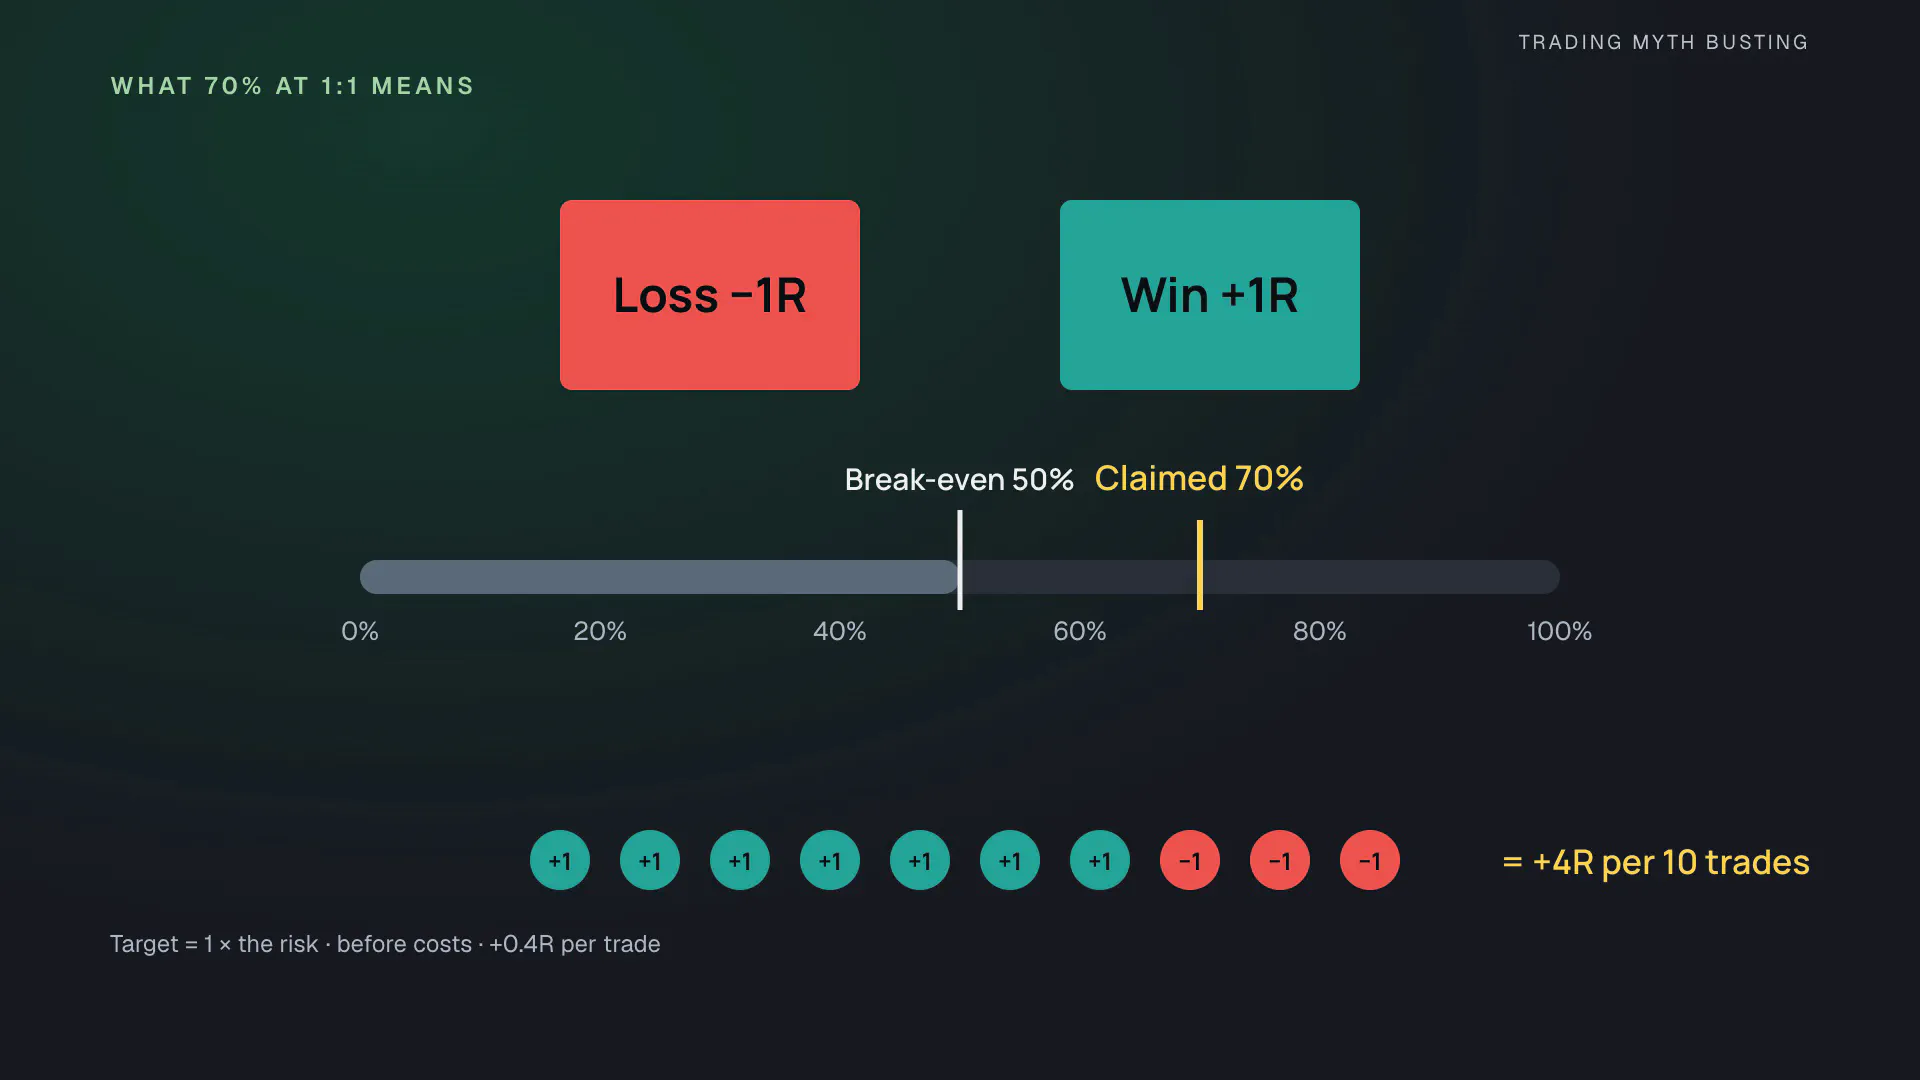
At 1:1 a win pays exactly what a loss costs: +1R against −1R, where R is the risk of the trade. So 50% just breaks even. At 70%, every 10 trades leave 7 − 3 = 4 times the risk ahead, +0.4R per trade before costs. That is a strong edge, and it can be measured.
The rules
- The bias: yesterday’s daily candle and the last 4-hour candle that closed before the open must agree. Both green: longs only. Both red: shorts only. Mixed: no trade.
- The level: after a rise, at least 2 red candles. The highest of their bodies is the level.
- The breakout: a green candle closes above the level, with a wick on top. It can’t be taller than half of the range.
- The entry: a later candle leaves a wick of at least 5 points underneath. A buy stop goes at the breakout candle’s high, the stop at its low, the target at 1:1. If a candle closes back below the level first, the setup is off.
Shorts mirror the rules. Breakouts count from 9:30 to 10:30 New York time, an order still waiting at 10:30 is cancelled, and there is one trade a day.
Where the interview leaves room, the plan fixes the details. The daily candle runs from 17:00 to 17:00 New York time, the CFD and futures trading day, so the 4-hour candle before the 9:30 open is the 5:00–9:00 one. The range starts with the run of red candles and ends with the breakout candle. The 5-point wick is his rule of thumb for the Nasdaq (48:58). A trade still open at 16:00 is closed. The parts he calls judgment are left out: the story behind a mixed day, a clean zone to the left, a daily resistance nearby, and how good a wick looks.
A classic Pine Script pitfall
His free bias indicator asks for the previous 4-hour candle like this:
[cl, op] = request.security("", "240", [close[1], open[1]])
Live, this reads the right candle: the 4-hour candle that is still forming counts as the current one, so [1] is the last closed candle. On past candles the current one is already closed, so [1] is the one before it. At the 9:30 open that is mostly the 1:00–5:00 candle instead of the 5:00–9:00 one. In our check, this expression gave a different bias from an independent calculation on 380 of 742 days. So if you scroll back to check his bias, you’re often checking the wrong candle.
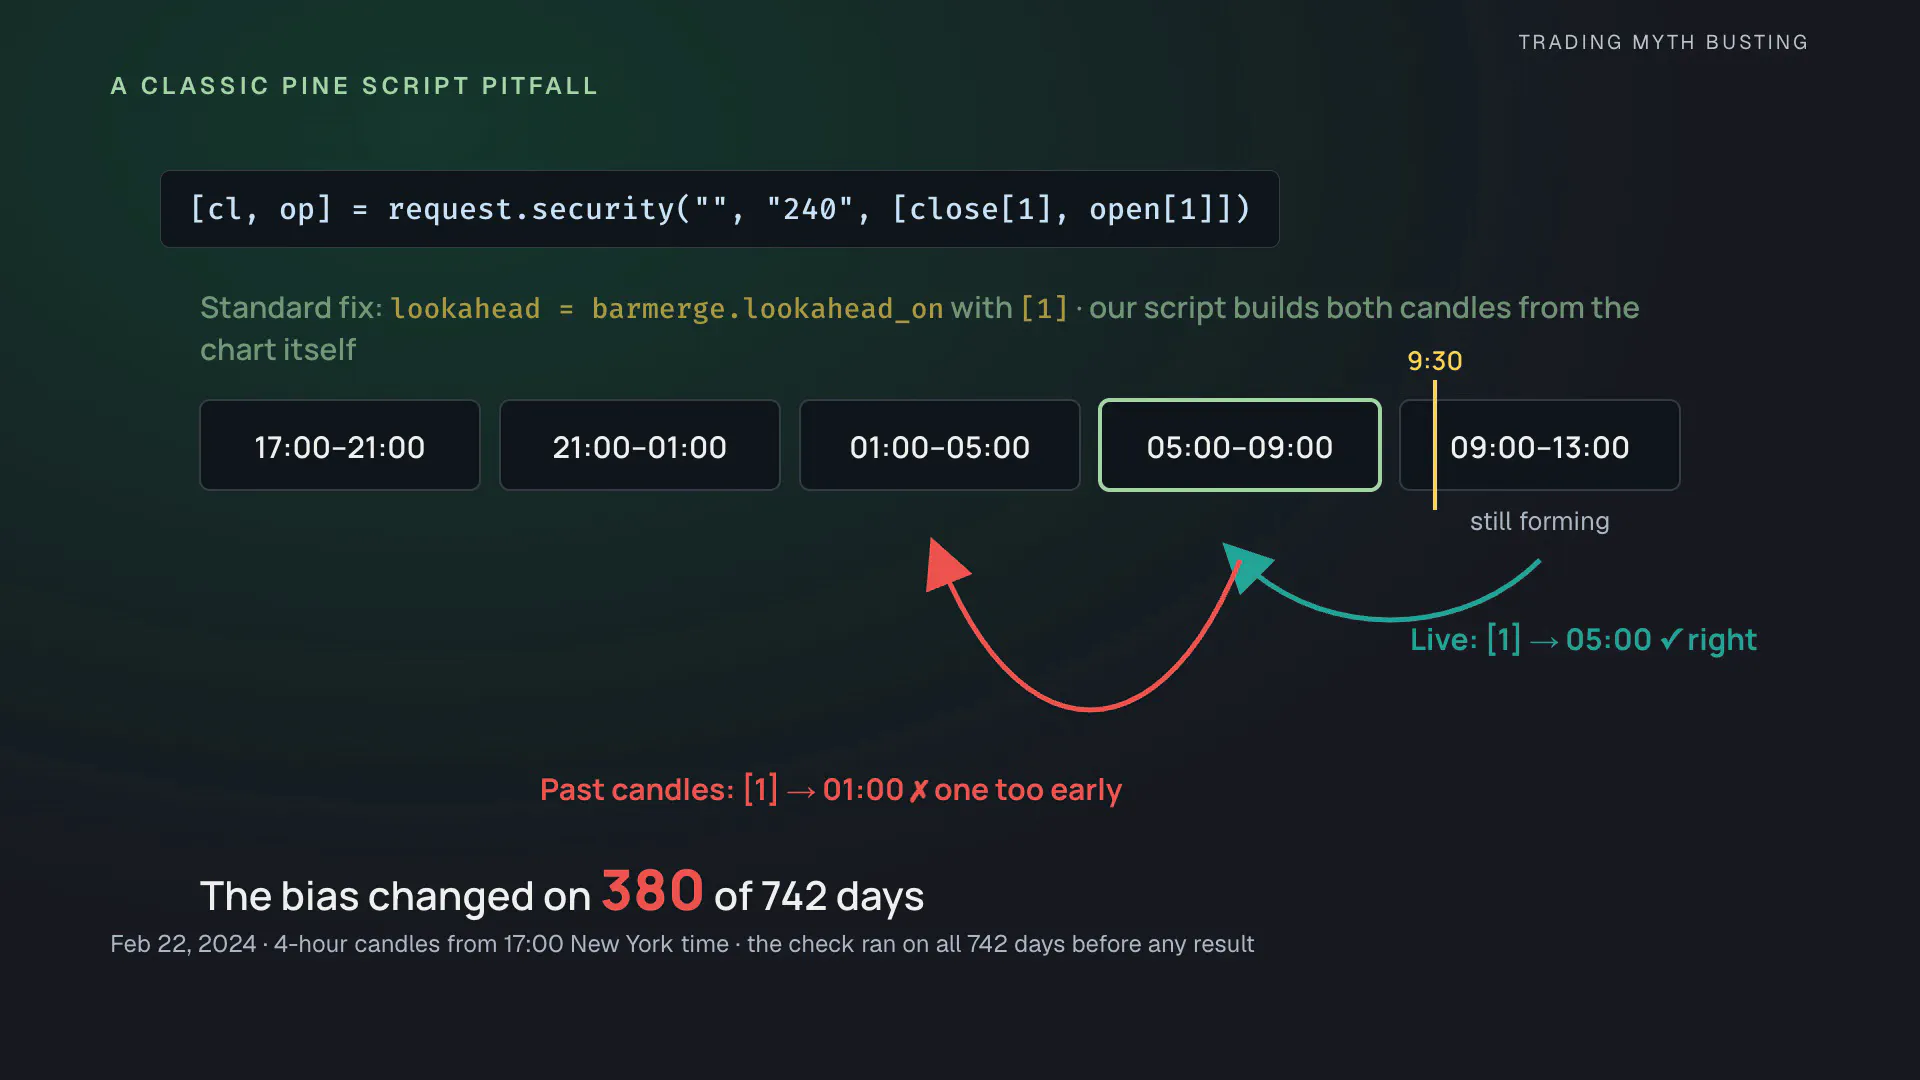
TradingView’s documentation on repainting describes the form that reads the same candle in both cases: the [1] offset together with lookahead = barmerge.lookahead_on. Our script builds the daily and 4-hour candles itself from the 5-minute candles, so the strategy reads the same candles in every engine. With that, the script’s bias matched the independent calculation on all 742 days.
Receipt 1: do 2 candles give the direction?
He says that when the 2 candles agree, there’s a “very high chance” that the session goes their way (5:58). We measured the session as the 9:00–13:00 New York 4-hour candle.
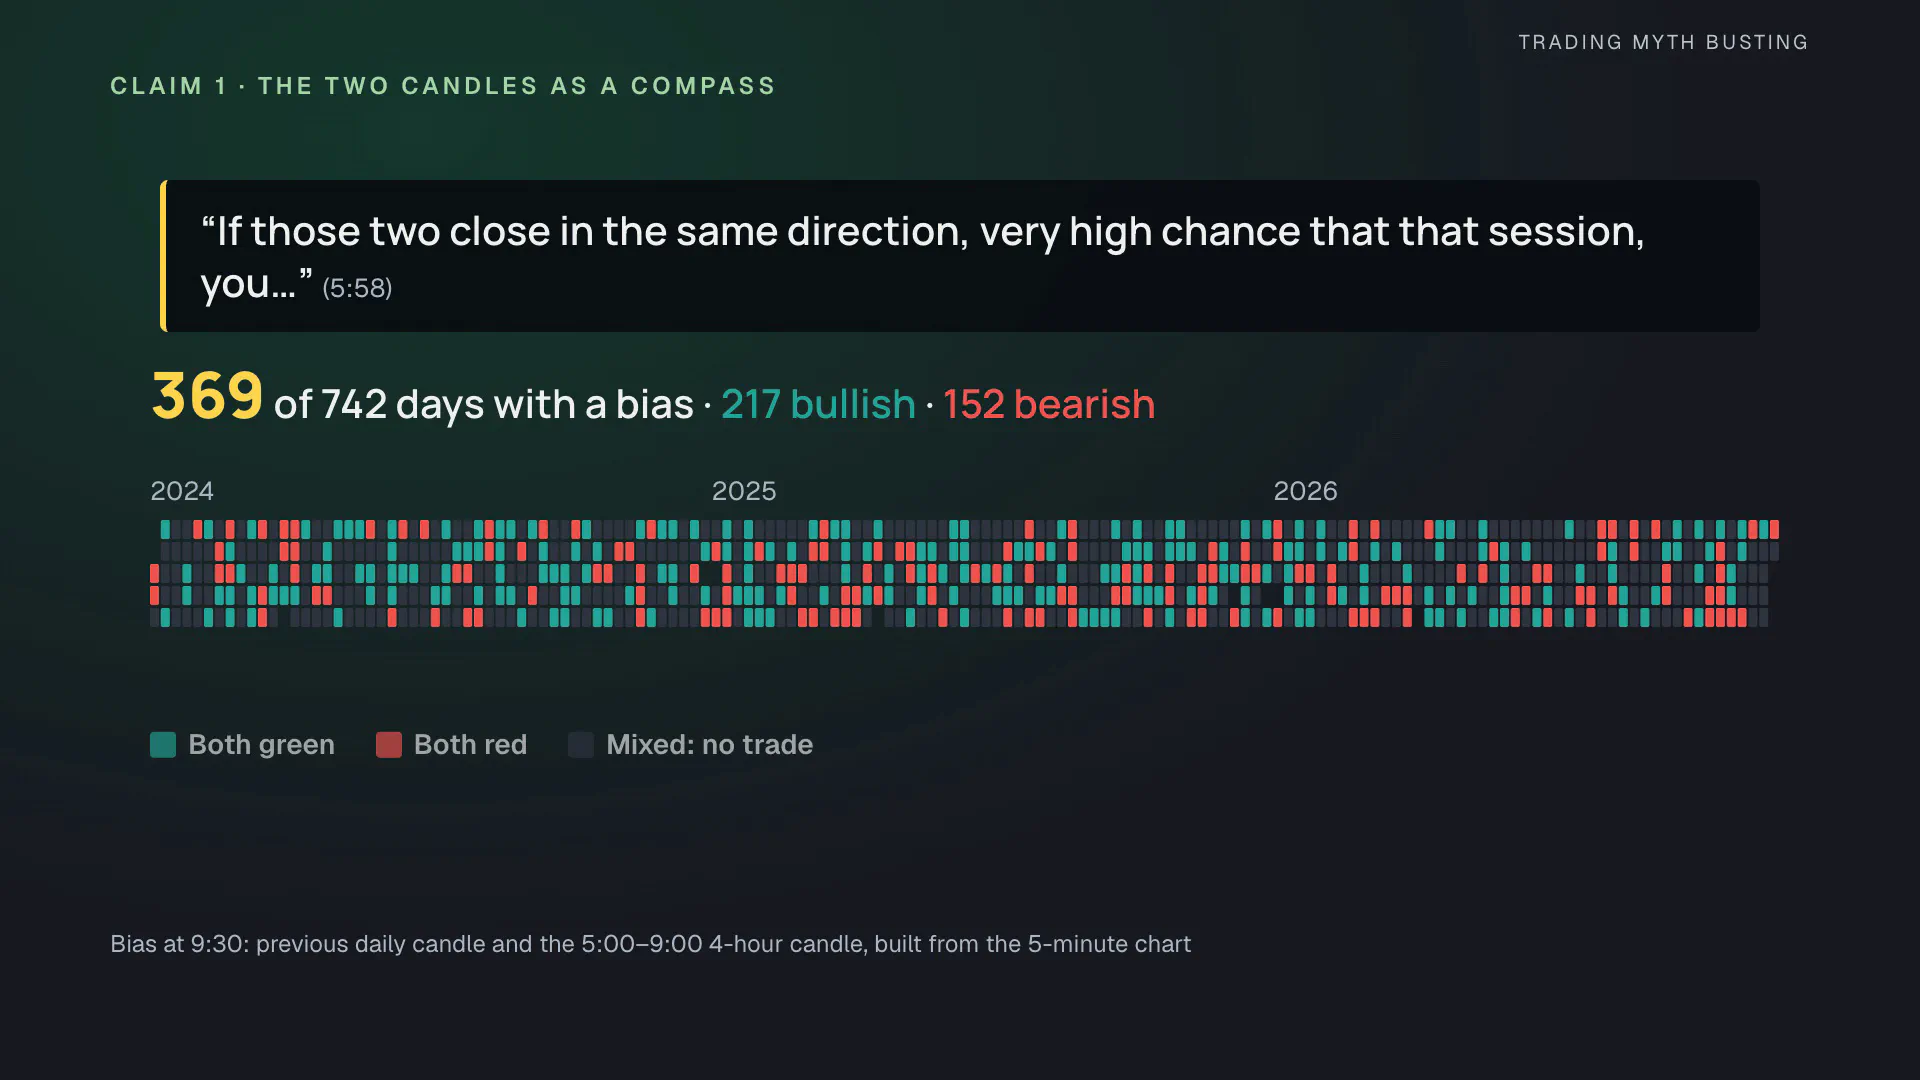
Out of 742 trading days, the 2 candles agreed on 369: 217 bullish and 152 bearish. The other 373 days were mixed, with no trade.
| Outcome | Bias right (95% interval) | Buy every day, same days | Up after bullish | Up after bearish |
|---|---|---|---|---|
| 9:00–13:00 4-hour candle (primary) | 47.7% (42.7–52.8%) | 48.8% | 47.0% | 51.3% |
| 9:30 to 16:00 | 47.1% (42.1–52.2%) | 47.7% | 45.6% | 50.7% |
| 9:30 to 10:30 | 47.7% (42.7–52.8%) | 48.8% | 47.0% | 51.3% |
After a bullish signal the session closed up less often than after a bearish one. The difference, −4.3 points, has a 95% interval from −13.1 to +4.5 points, so it includes zero. Flipping the signal gives 52.3%, and selling every day 51.2%; that flip was not part of the plan, and it isn’t a signal either. Verdict: no better than chance.
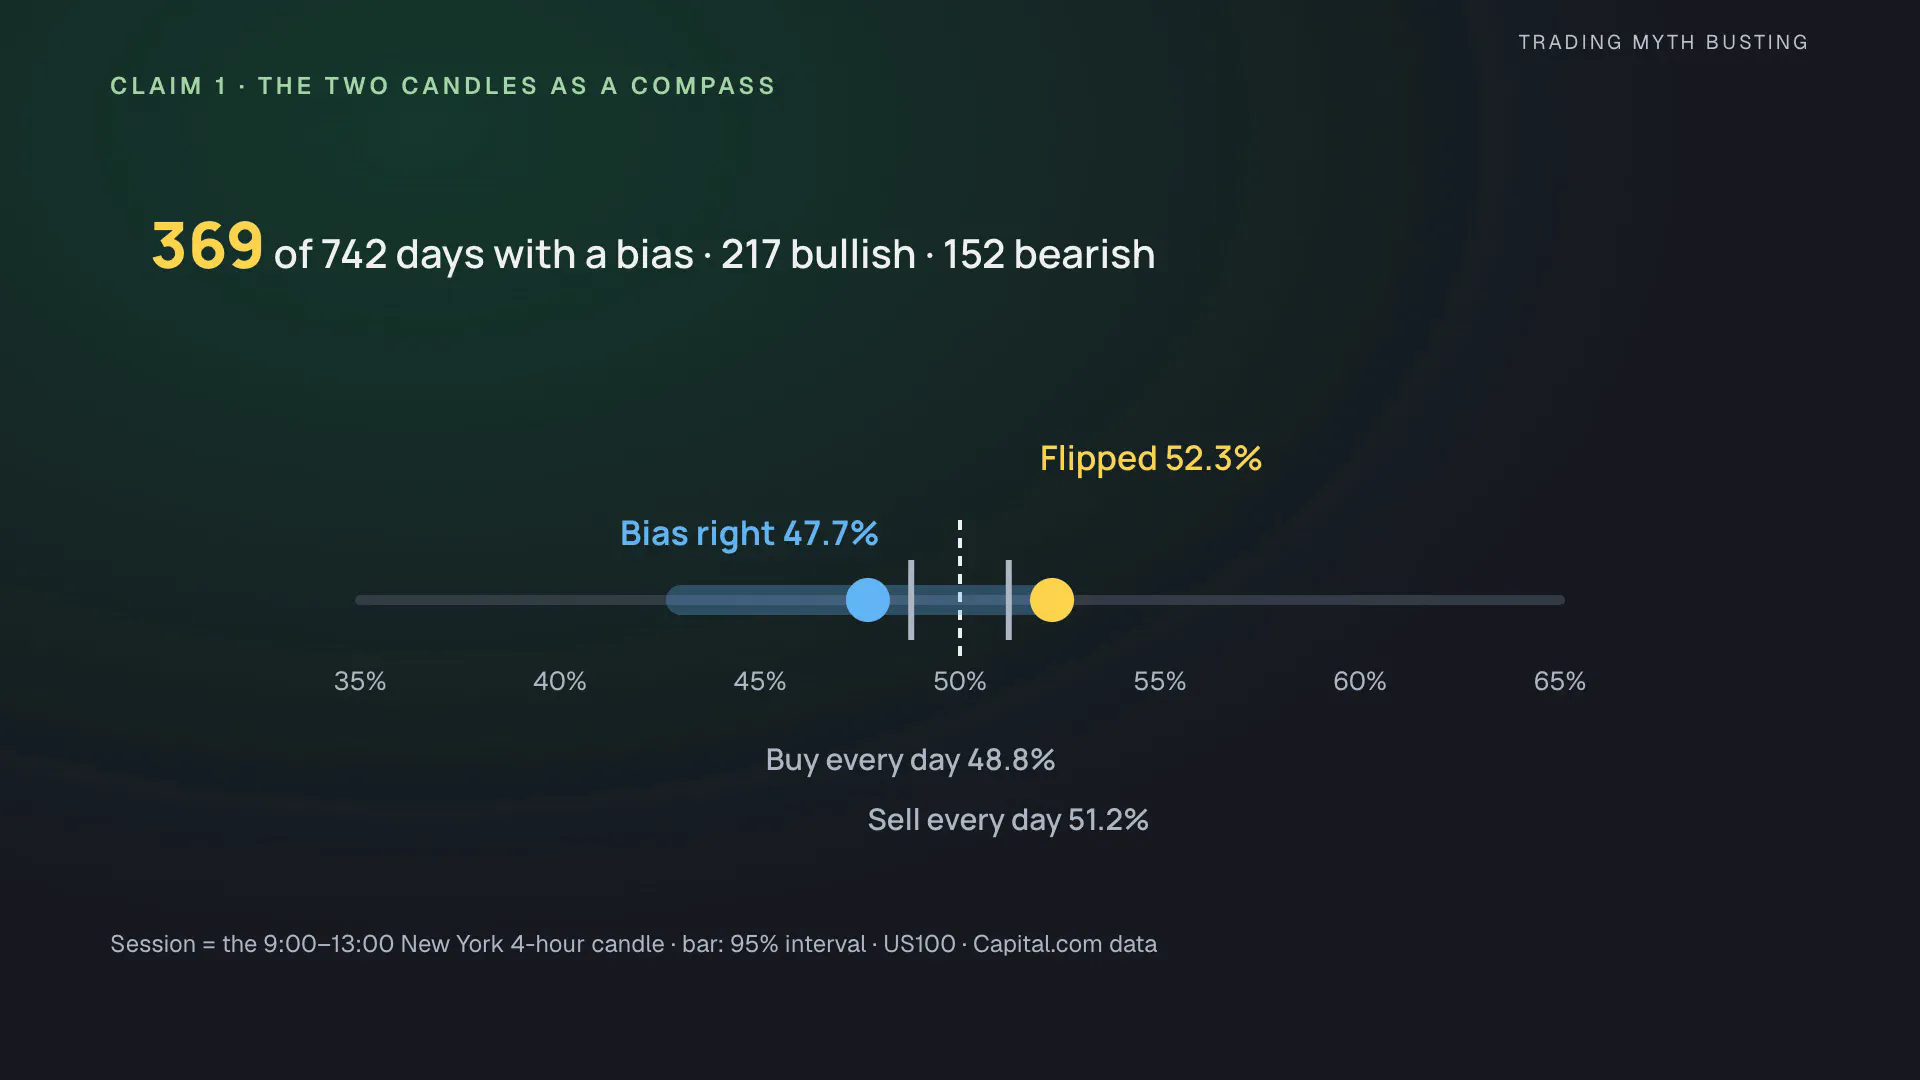
The 9:00–13:00 row and the first-hour row have the same numbers although the 2 outcomes differ on 84 bias days: the differences cancel out exactly in both groups. A few viewers ran similar checks in the comments and got about the same result.
One morning by the rules
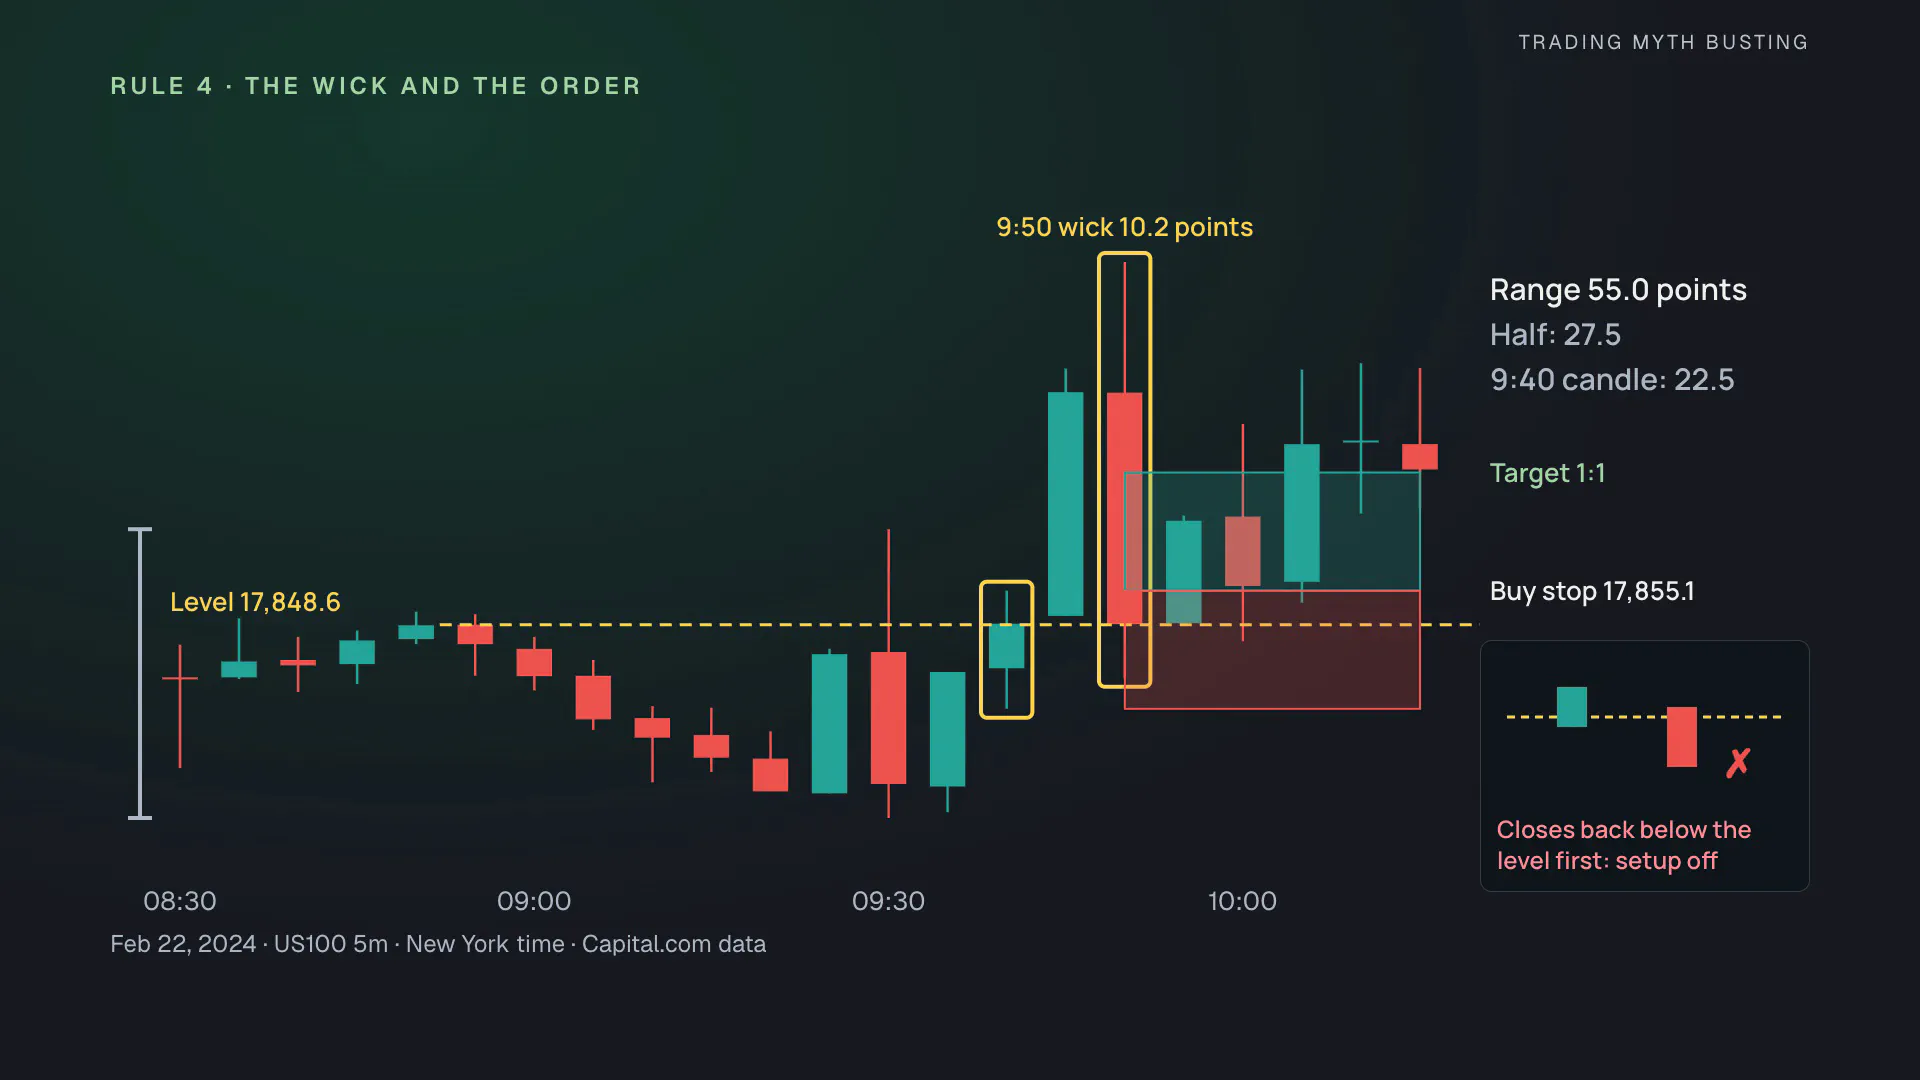
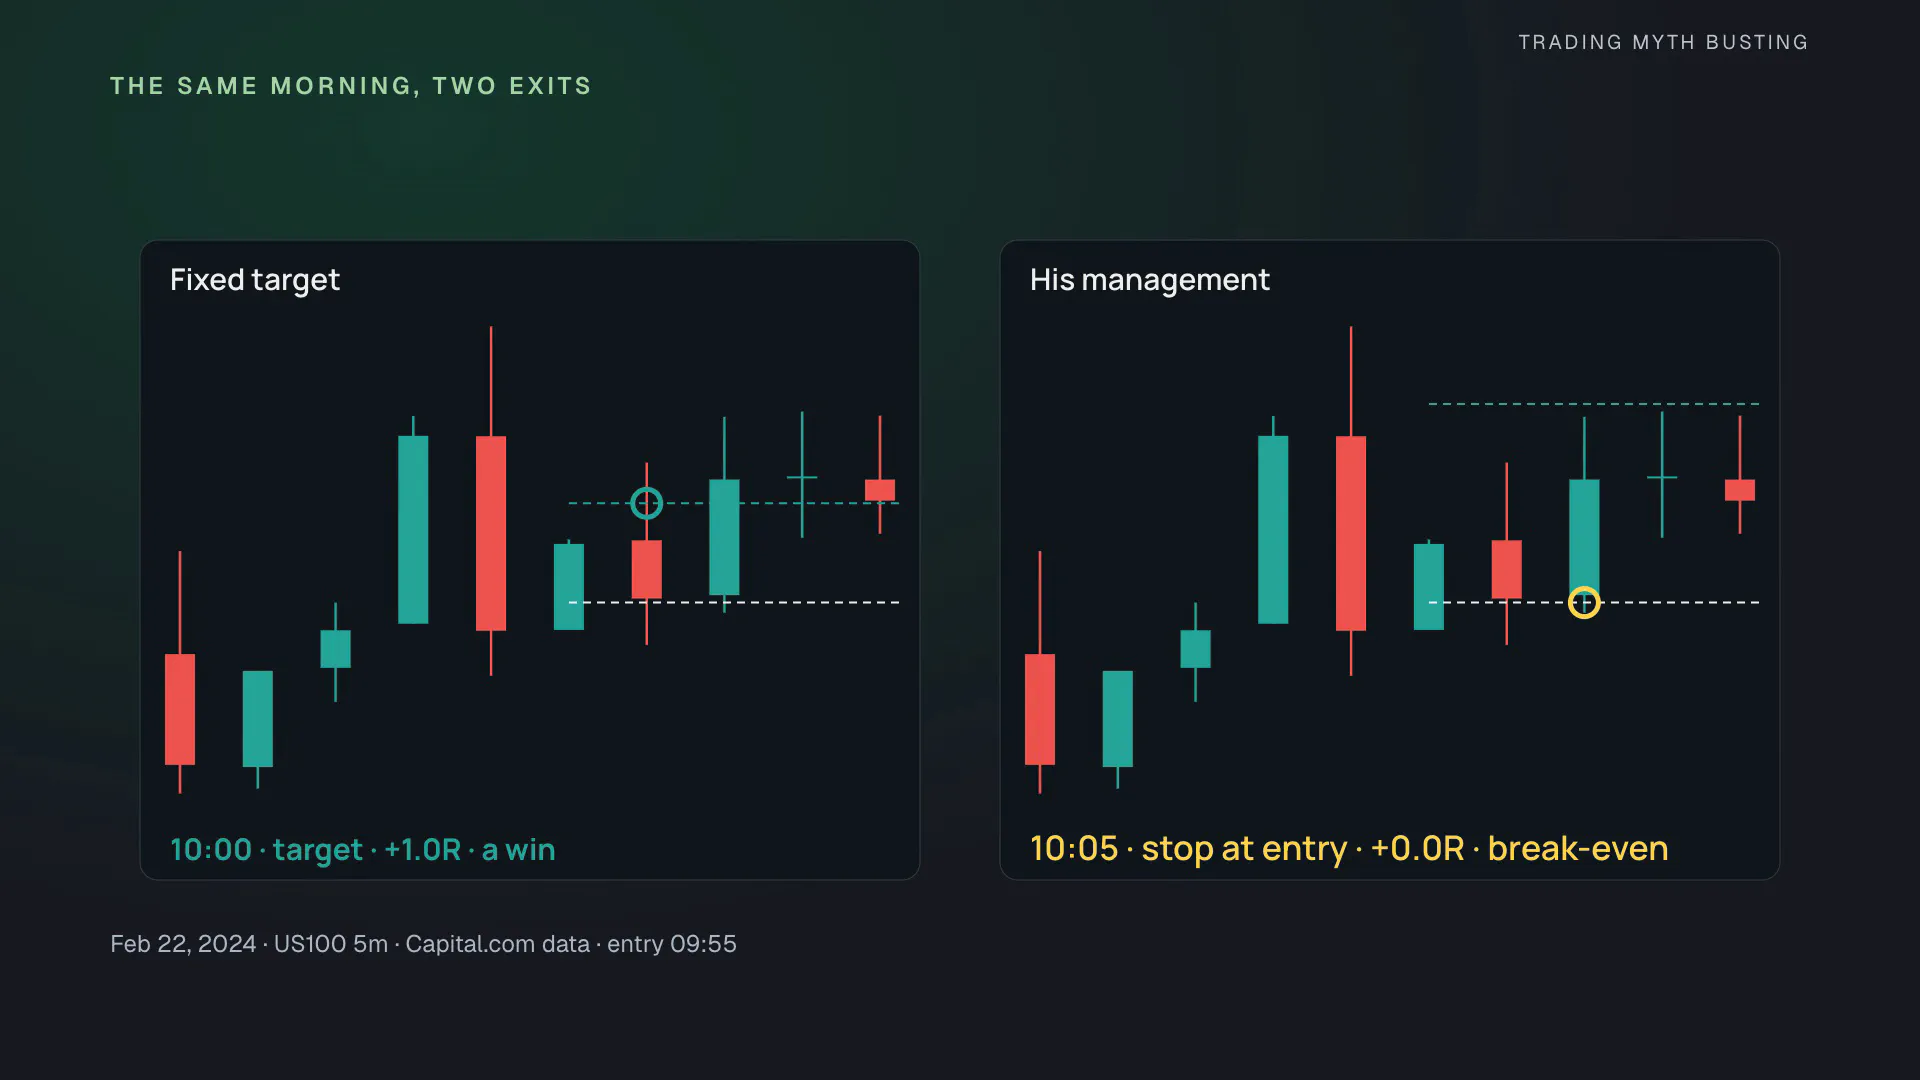
February 22, 2024. Yesterday’s daily candle closed green, and so did the 5:00–9:00 4-hour candle. Longs only. Before the open, 6 red candles from 8:55 to 9:20 set the level at 17,848.6, the open of the 8:55 candle. At 9:40 a green candle closes just above it, at 17,848.8, with a wick on top; it is 22.5 points tall, less than half of the 55.0-point range. The 9:45 candle has no lower wick. At 9:50 a pullback leaves a 10.2-point wick underneath. The buy stop waits at the 9:40 high.
It fills at 9:55, at 17,855.1. The stop is 22.5 points away, and the target, 17,877.6, is hit in the 10:00 candle. +1.00R. Done for the day.
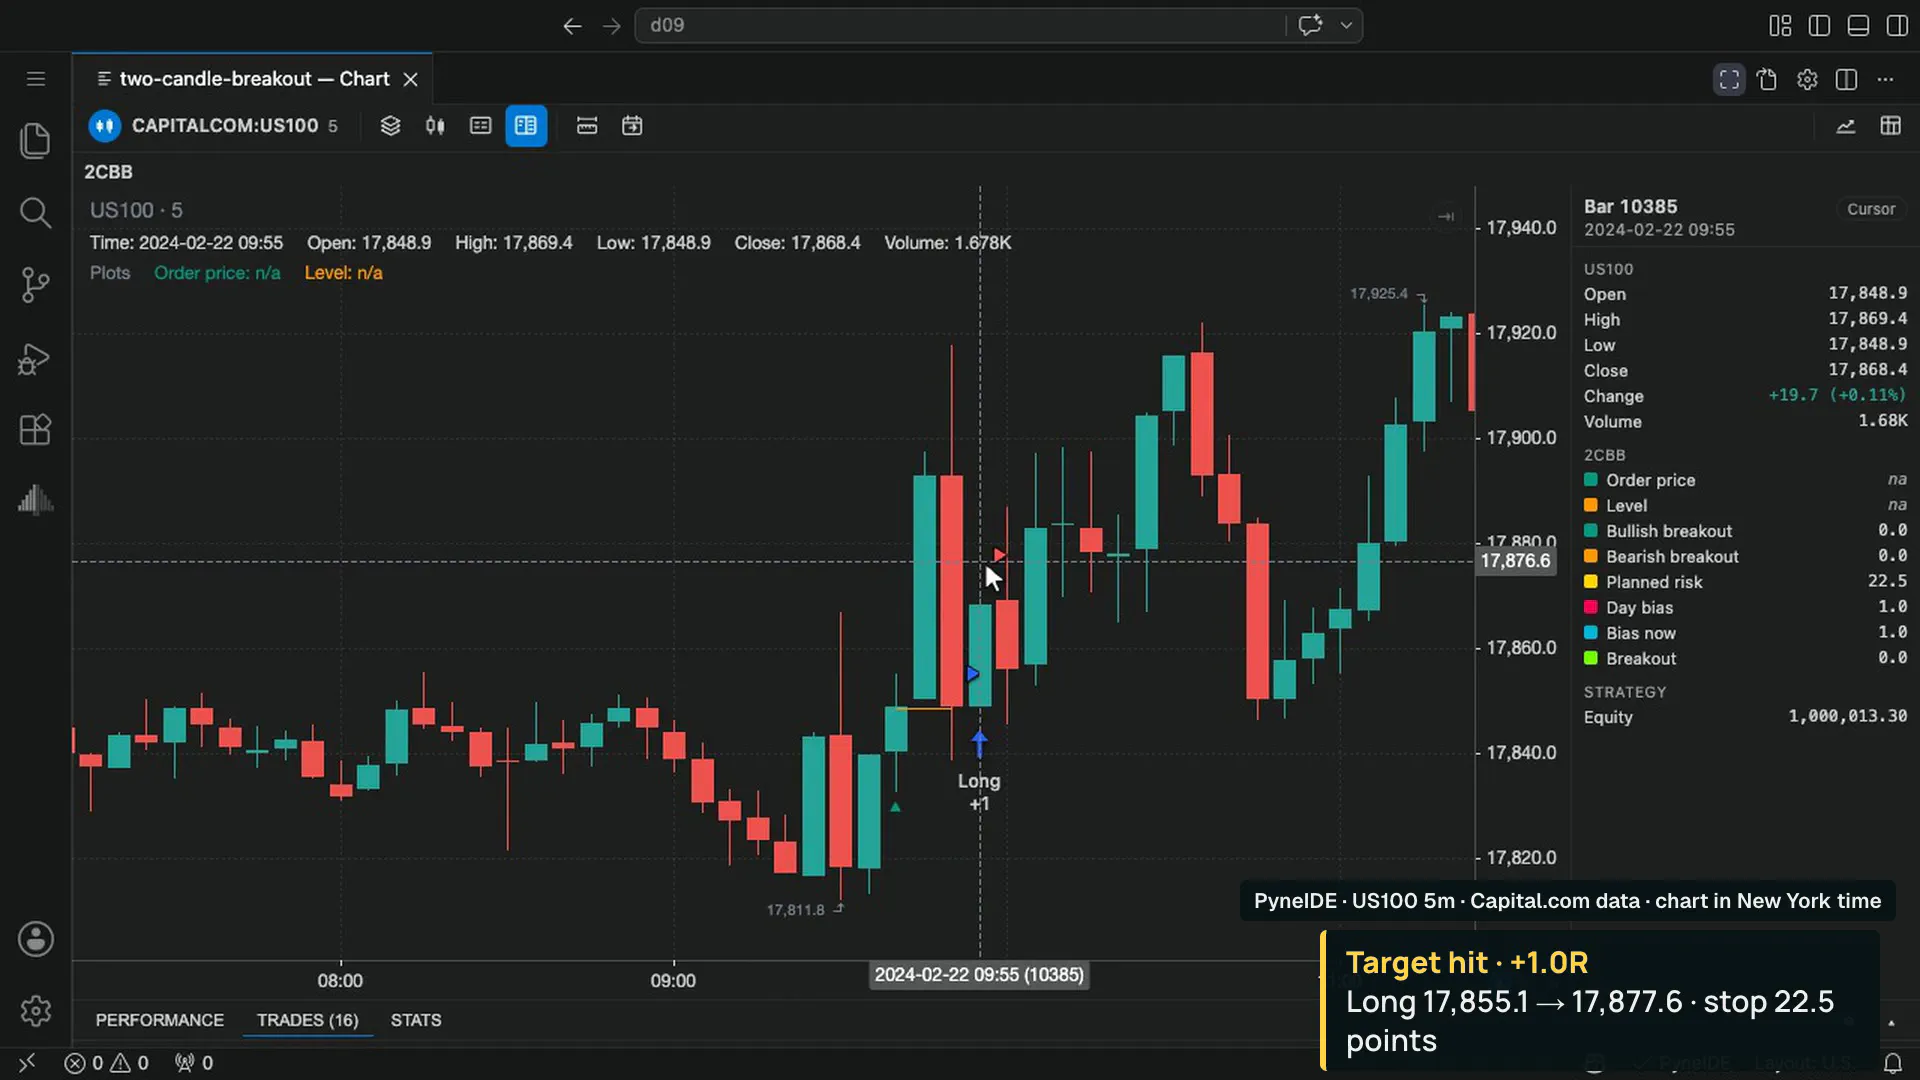
So far, the rules hold up.
$1,000 against a coin
Both simulated accounts start with $1,000 and risk 1% per trade. The coin gets the same entry trigger, the same stop and the same target distance, and only picks the direction; its account is the median of 200 full runs.
It’s a slow race. In almost 3 years, the rules found a trade on 16 days, about one every 46 trading days: 5 in 2024, 7 in 2025 and 4 in 2026. The 173 breakouts that formed in the window were whittled down by the bias, the wick and the cancellation rule.
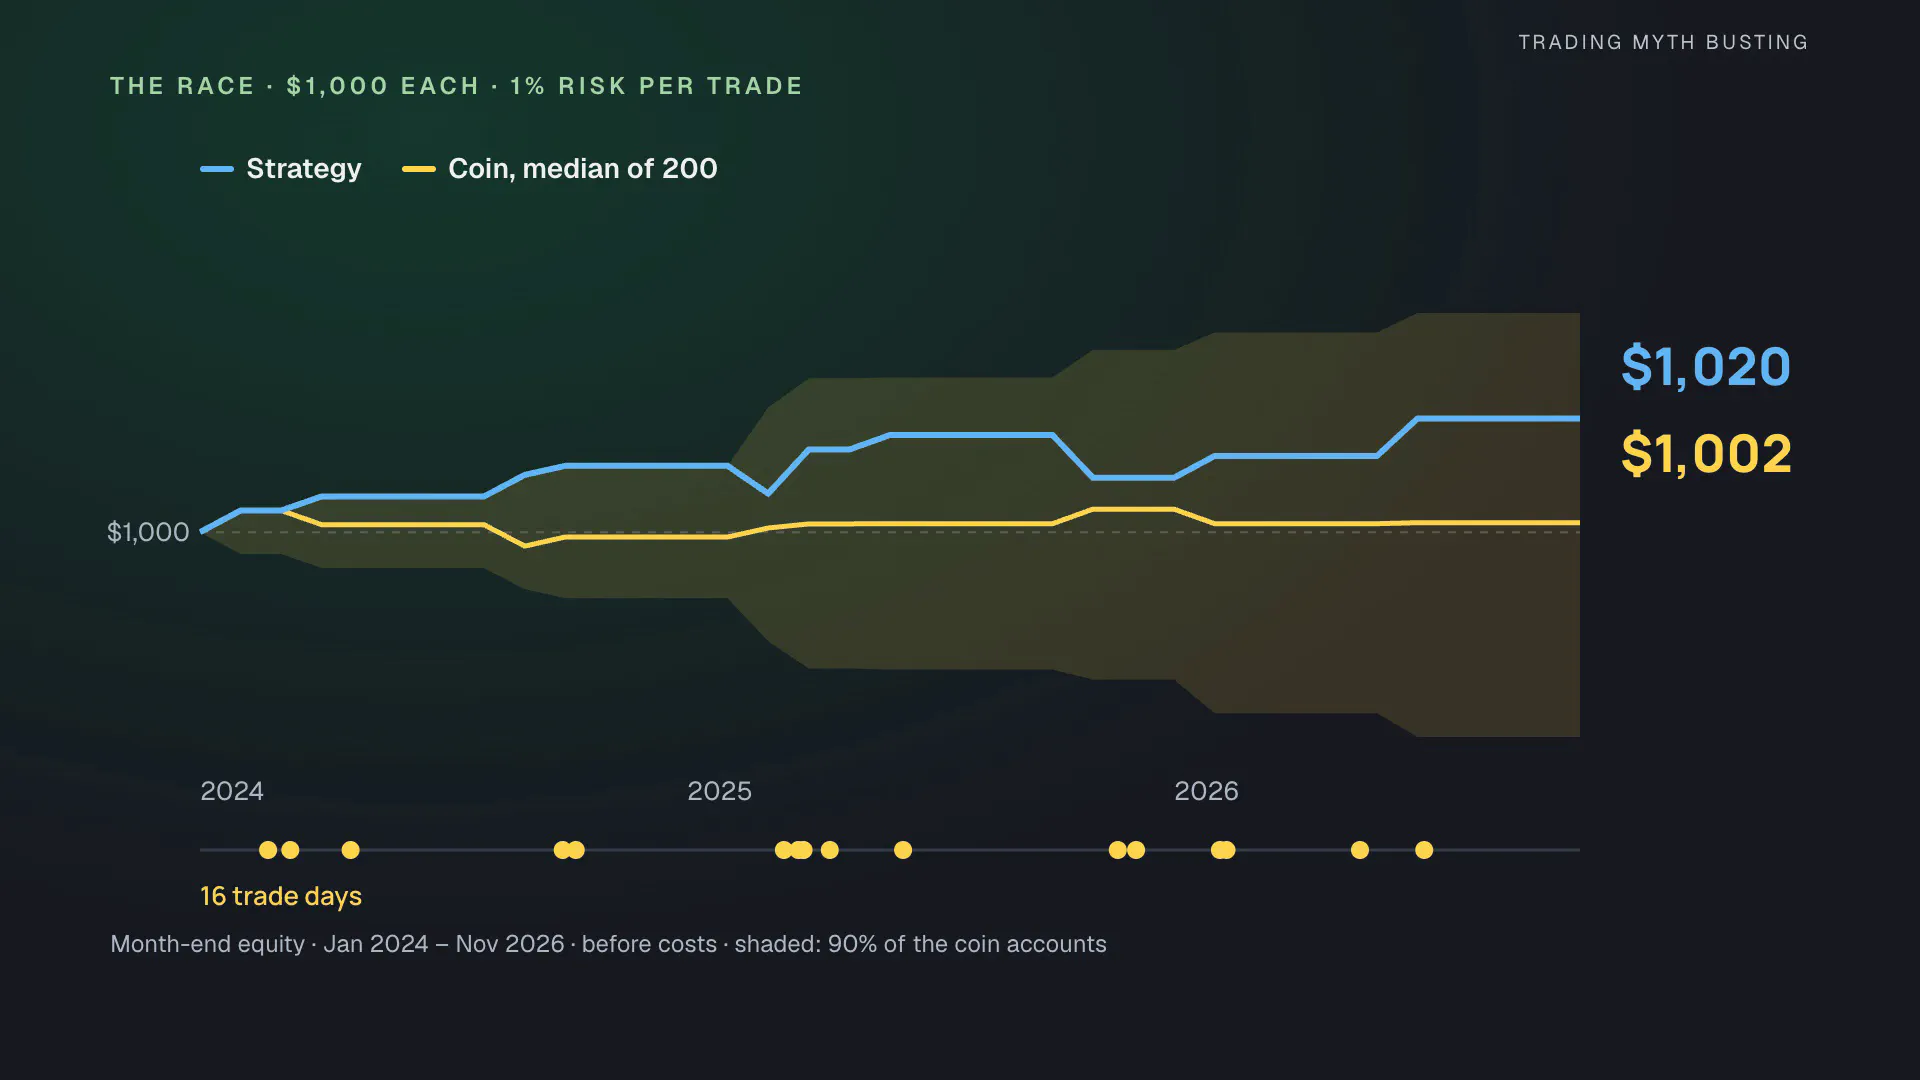
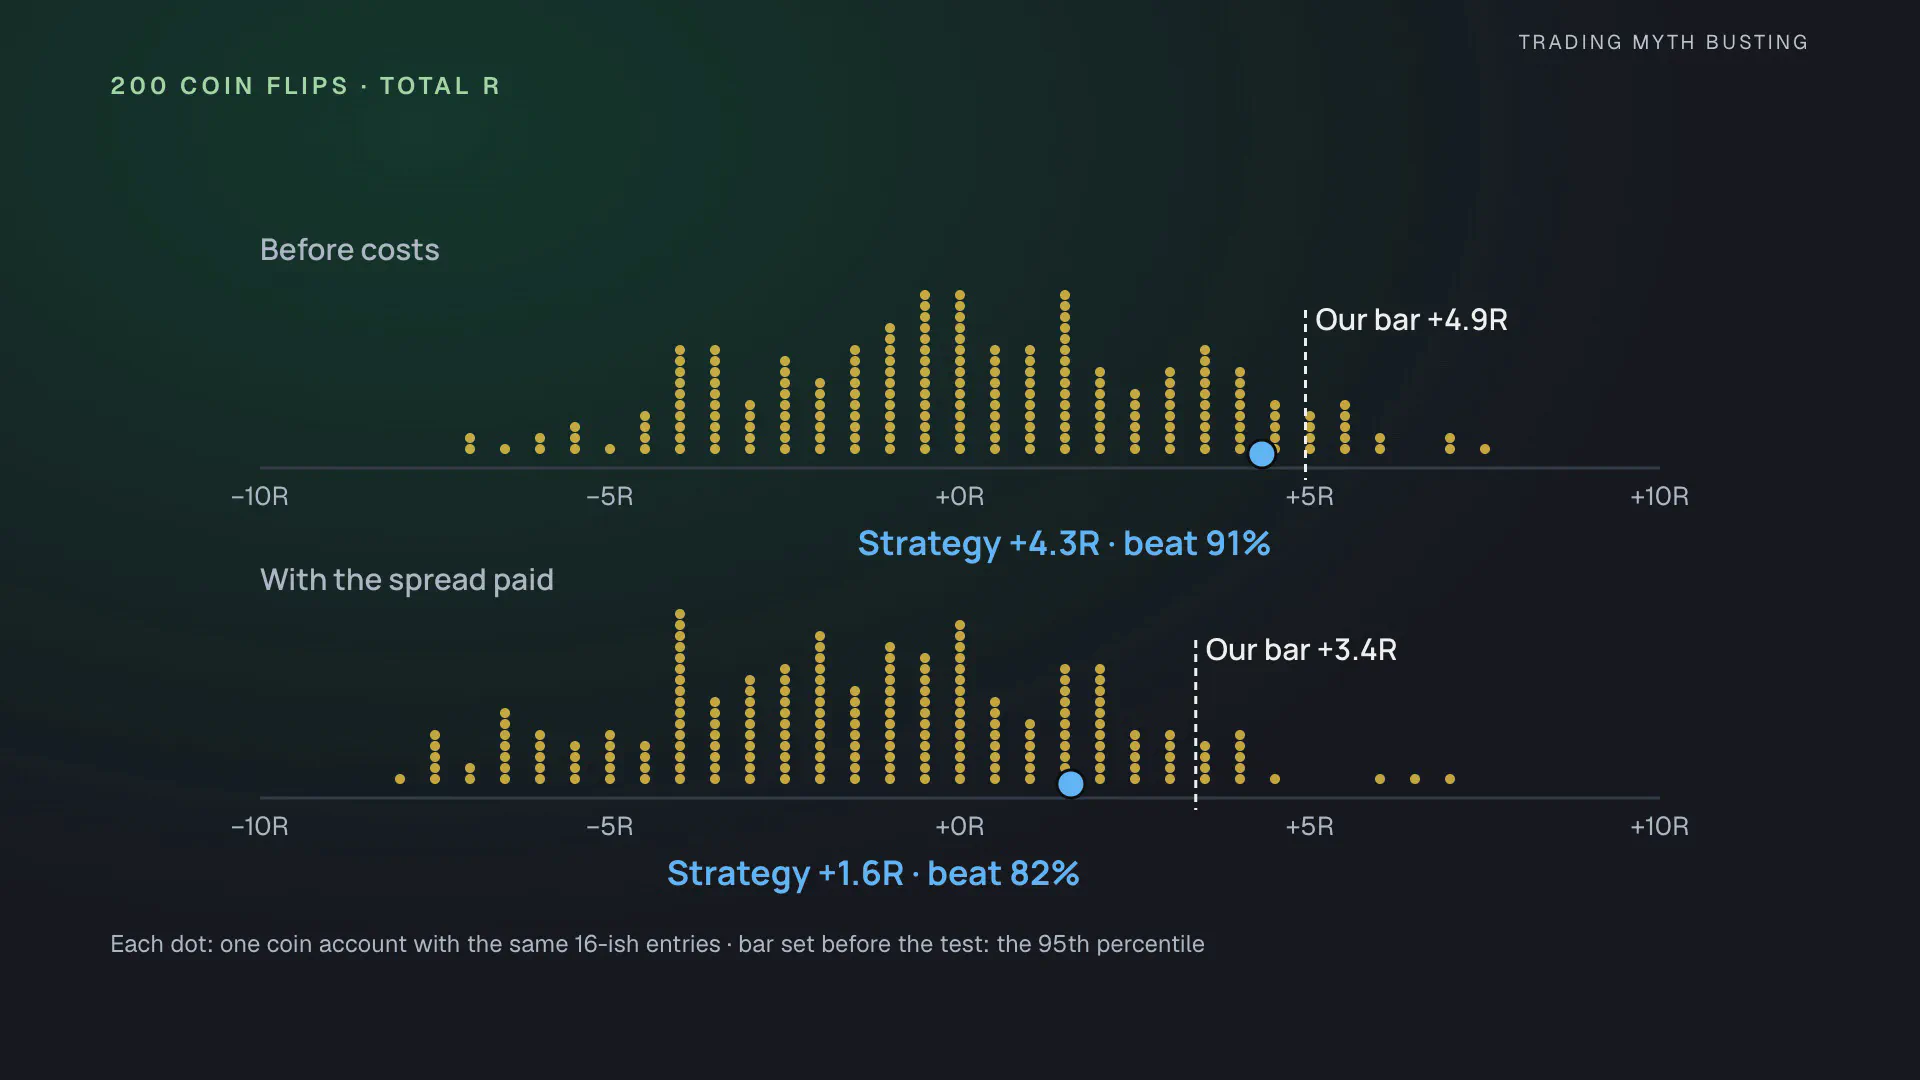
At the end the strategy is ahead: $1,019.80 against the coin’s $1,001.70. Measured in R, the strategy made +4.31R and beat 91% of the 200 coin runs. Our bar, set before the test, was 95%: the coins’ 95th percentile was +4.94R.
| Fixed 1R | Before costs | With the spread |
|---|---|---|
| Trades | 16 | 18 |
| Win rate (95% interval) | 62.5% (38.6–81.5%) | 55.6% |
| Average result | +0.27R | +0.09R |
| Total | +4.31R | +1.58R |
| Largest drawdown | −1.37R | −3.11R |
| Coin median | −0.06R | −1.39R |
| Share of coin runs beaten | 91% | 82% |
| $1,000 account, final | $1,019.80 | $1,009.60 |
| Coin account, median final | $1,001.70 | $995.50 |
| Verdict | No edge over a coin flip | No edge over a coin flip |
The coin’s median win rate was 37.5%: a limit order against the breakout fills when the price runs through the level in the breakout’s direction, which tilts the coin’s draws slightly toward the real direction.
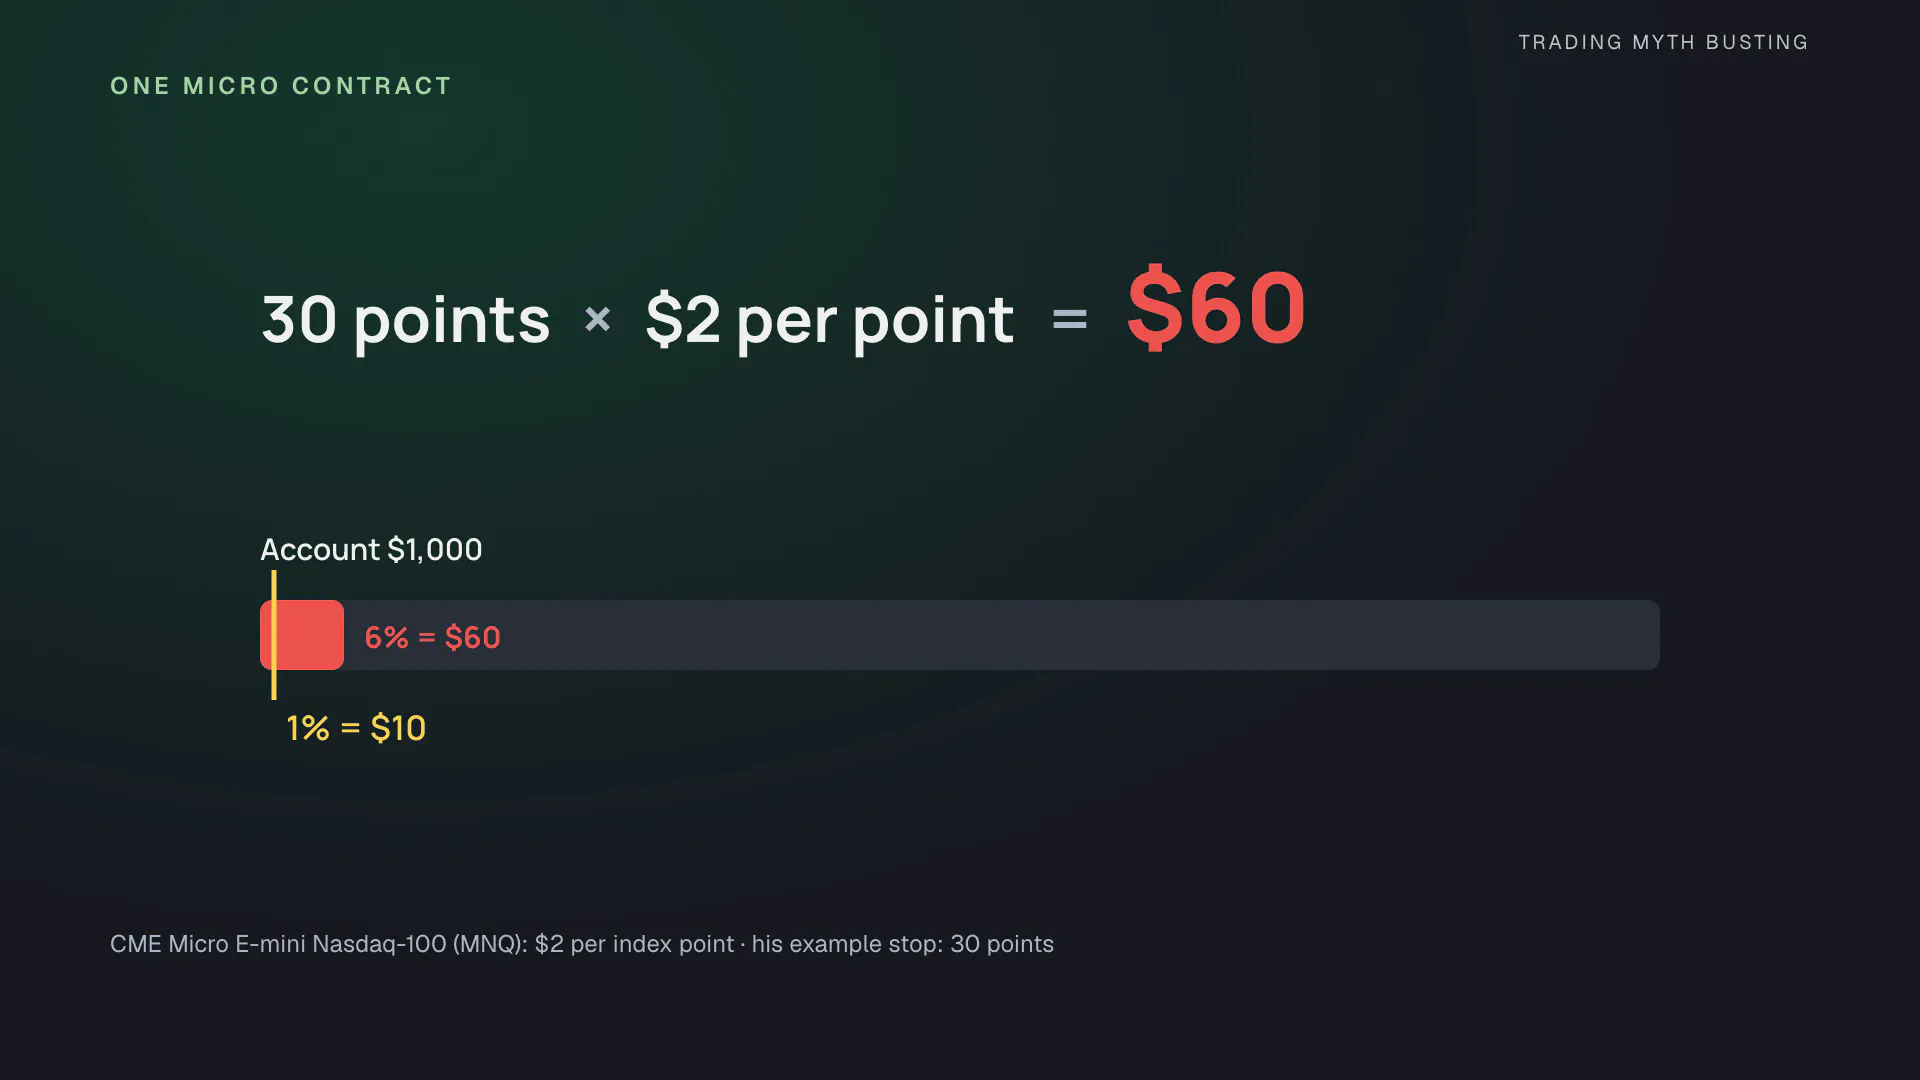
One more thing about $1,000. With real futures, one Micro E-mini Nasdaq-100 contract is worth $2 per point, so a 30-point stop, about the size of his stops in the interview, risks $60: 6% of $1,000.
Receipt 2: the same 16 trades, 4 win rates
In PyneIDE the exit is one input of the same script: “Fixed 1R”, or “Break-even at 1R, 2R target”, the management from his example ("…you move the stop loss to break even", 45:18). We ran both on the same data and read the Stats tab after each run.
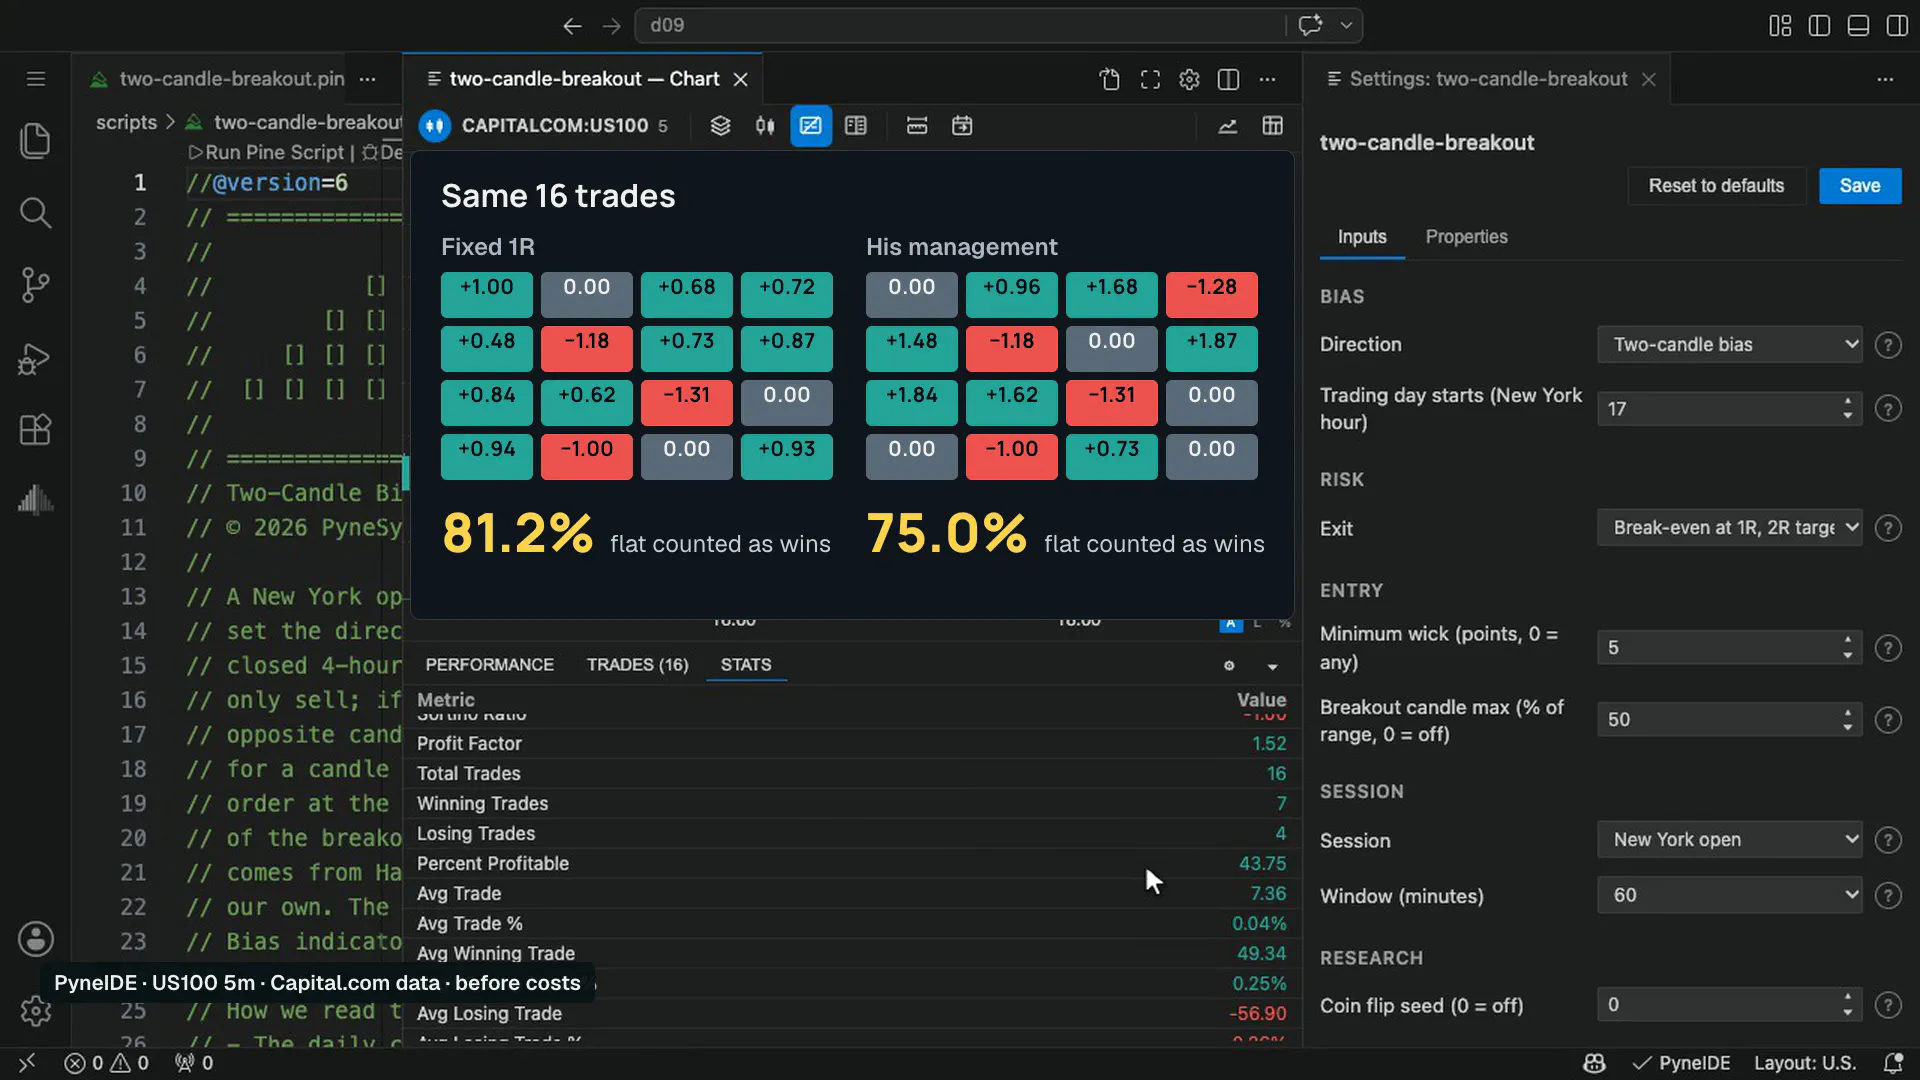
| Exit | Trades | Wins | Flat | Losses | Win rate | Flat counted as a win | Flat left out | Total R |
|---|---|---|---|---|---|---|---|---|
| Fixed 1R | 16 | 10 | 3 | 3 | 62.5% | 81.2% | 76.9% | +4.31R |
| Break-even at 1R, 2R target | 16 | 7 | 5 | 4 | 43.8% | 75.0% | 63.6% | +5.40R |
The 3 flat trades of the fixed-1R test are not stop moves: their orders filled on a candle that opened past the target. The morning above shows the difference between the 2 exits on one trade: with a fixed target it is a win, with his management it closes at break-even at 10:05.
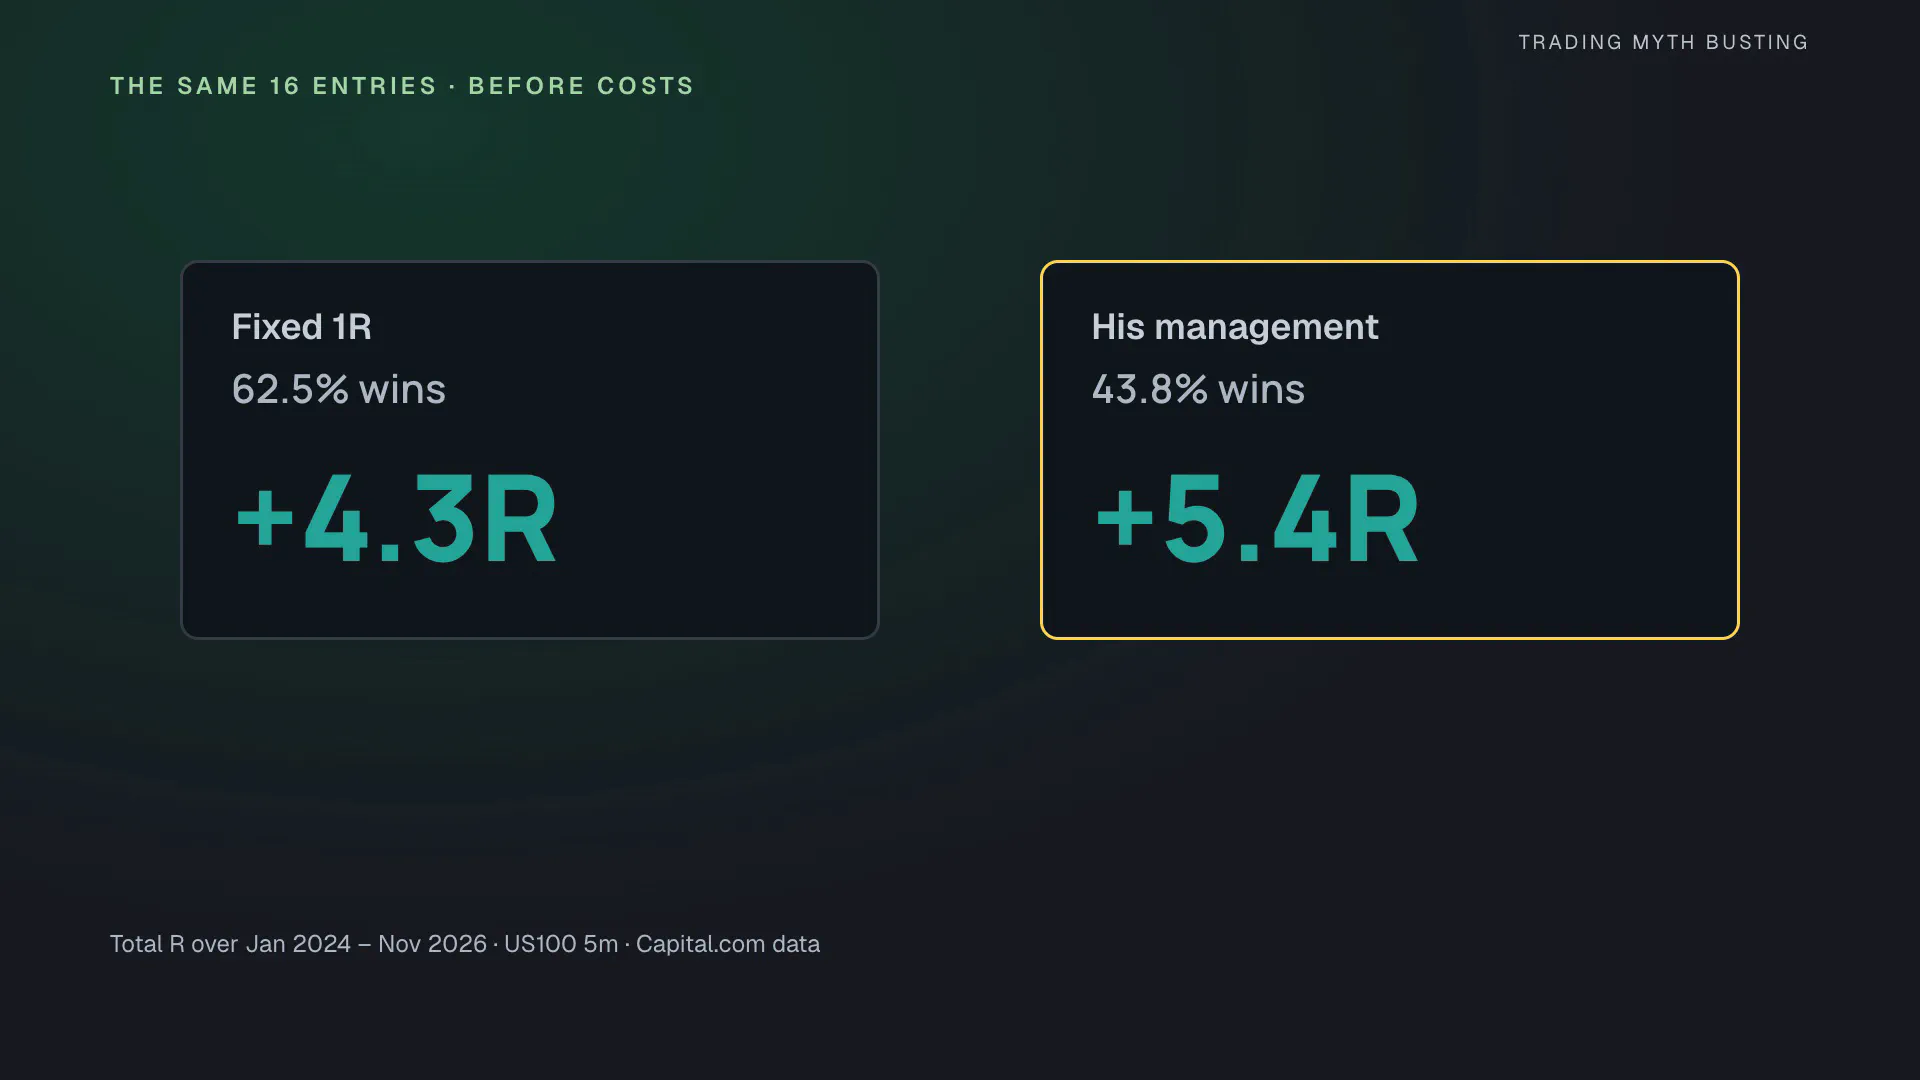
So which one is better? The version with the lower win rate earned more: +5.40R against +4.31R. A win rate without the size of the wins and what happens at break-even says very little.
And the 70%? With 16 trades, the 95% interval of the 62.5% win rate runs from 38.6% to 81.5%. 70% sits inside it, and so does 50%. We can’t prove it, and we can’t disprove it. Verdict: consistent with 70%, on 16 trades.
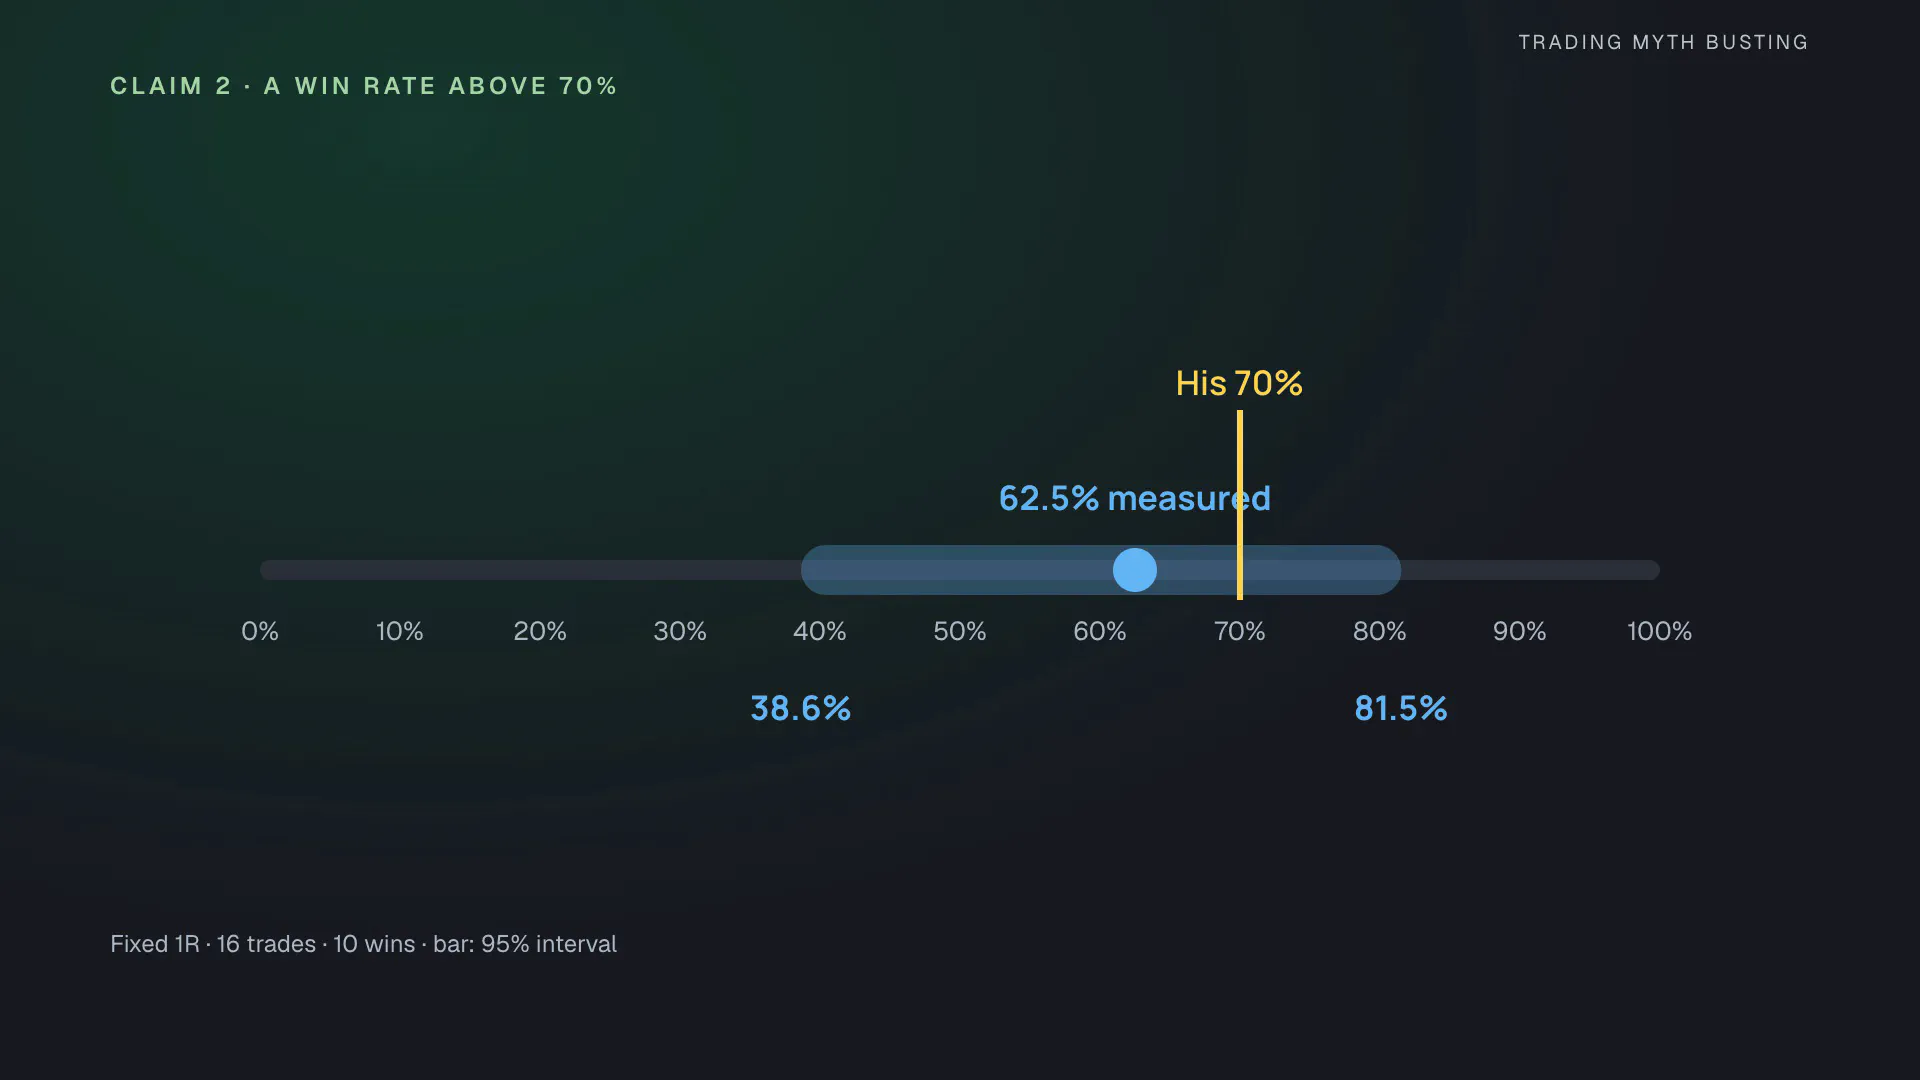
With his management the strategy also beat only 73% of the coin runs before costs, and 69% with the spread: no edge over a coin flip either.
The size of the wins
At 1:1 you would expect wins of +1R. Only one of the 10 winners of the fixed-1R test made exactly 1R: the February 22 trade. The others closed between +0.48R and +0.94R, and the losers at −1.00R, −1.18R and −1.31R. The reason is the fill. The buy stop goes in when the wick candle closes, and when the price is already above the breakout candle’s high by then, the order fills at the next candle’s open, at a worse price than planned. That happened, at the entry or the exit, on 11 of the 16 trades, and 7 trades opened and closed inside the same candle. In the interview the buy stop is placed at the breakout itself (40:03), and the wick is awaited before the fill; 5-minute candles can’t replay that order of events.
With clean +1R and −1R trades, 62.5% would mean +0.25R per trade; the measured average was +0.27R. 70% would mean +0.40R.
Does the bias filter help?
The same rule without the bias filter took 71 trades and won 59.2% before costs, +1.93R; with the spread, 75 trades, 54.7% and −4.24R. Per trade, the filtered rule averaged +0.27R and the unfiltered +0.03R. The difference, +0.24R, has a 95% interval from −0.13R to +0.57R: no measurable difference.
The spread
The Capital.com data stores the bid and the ask side of every candle, so in PyneCore buys can fill at the ask and sells at the bid. On 15 of the 16 trades the entry spread was 1.8 points, on one 13.5 points. The planned risk had a median of 29.3 points (quartiles 23.5 and 55.5), so the spread took about 6% of the risk, on average 0.046R per trade (95% interval 0.024–0.072R). With the spread, the fixed-1R rule made +1.58R on 18 trades, the break-even version +2.96R. Costs didn’t erase the result, but the result wasn’t an edge to begin with.
Receipt 3: “works on everything”
He also says “this strategy works on everything” (49:09). We ran the same rules, fixed 1R, 9:30 to 10:30 New York time, on 5 more Capital.com markets. The 5-point minimum wick was scaled to each market’s median risk, in the same proportion as 5 points to the Nasdaq 100’s median risk.
| Market | Trades | Total before costs | Total with the spread |
|---|---|---|---|
| S&P 500 (US500) | 20 | +4.33R | +3.70R |
| EUR/USD | 18 | +1.50R | −0.07R |
| GBP/USD | 17 | −1.65R | −4.16R |
| Gold | 28 | −1.96R | −4.42R (29 trades) |
| Bitcoin | 30 | −2.57R | −19.11R |
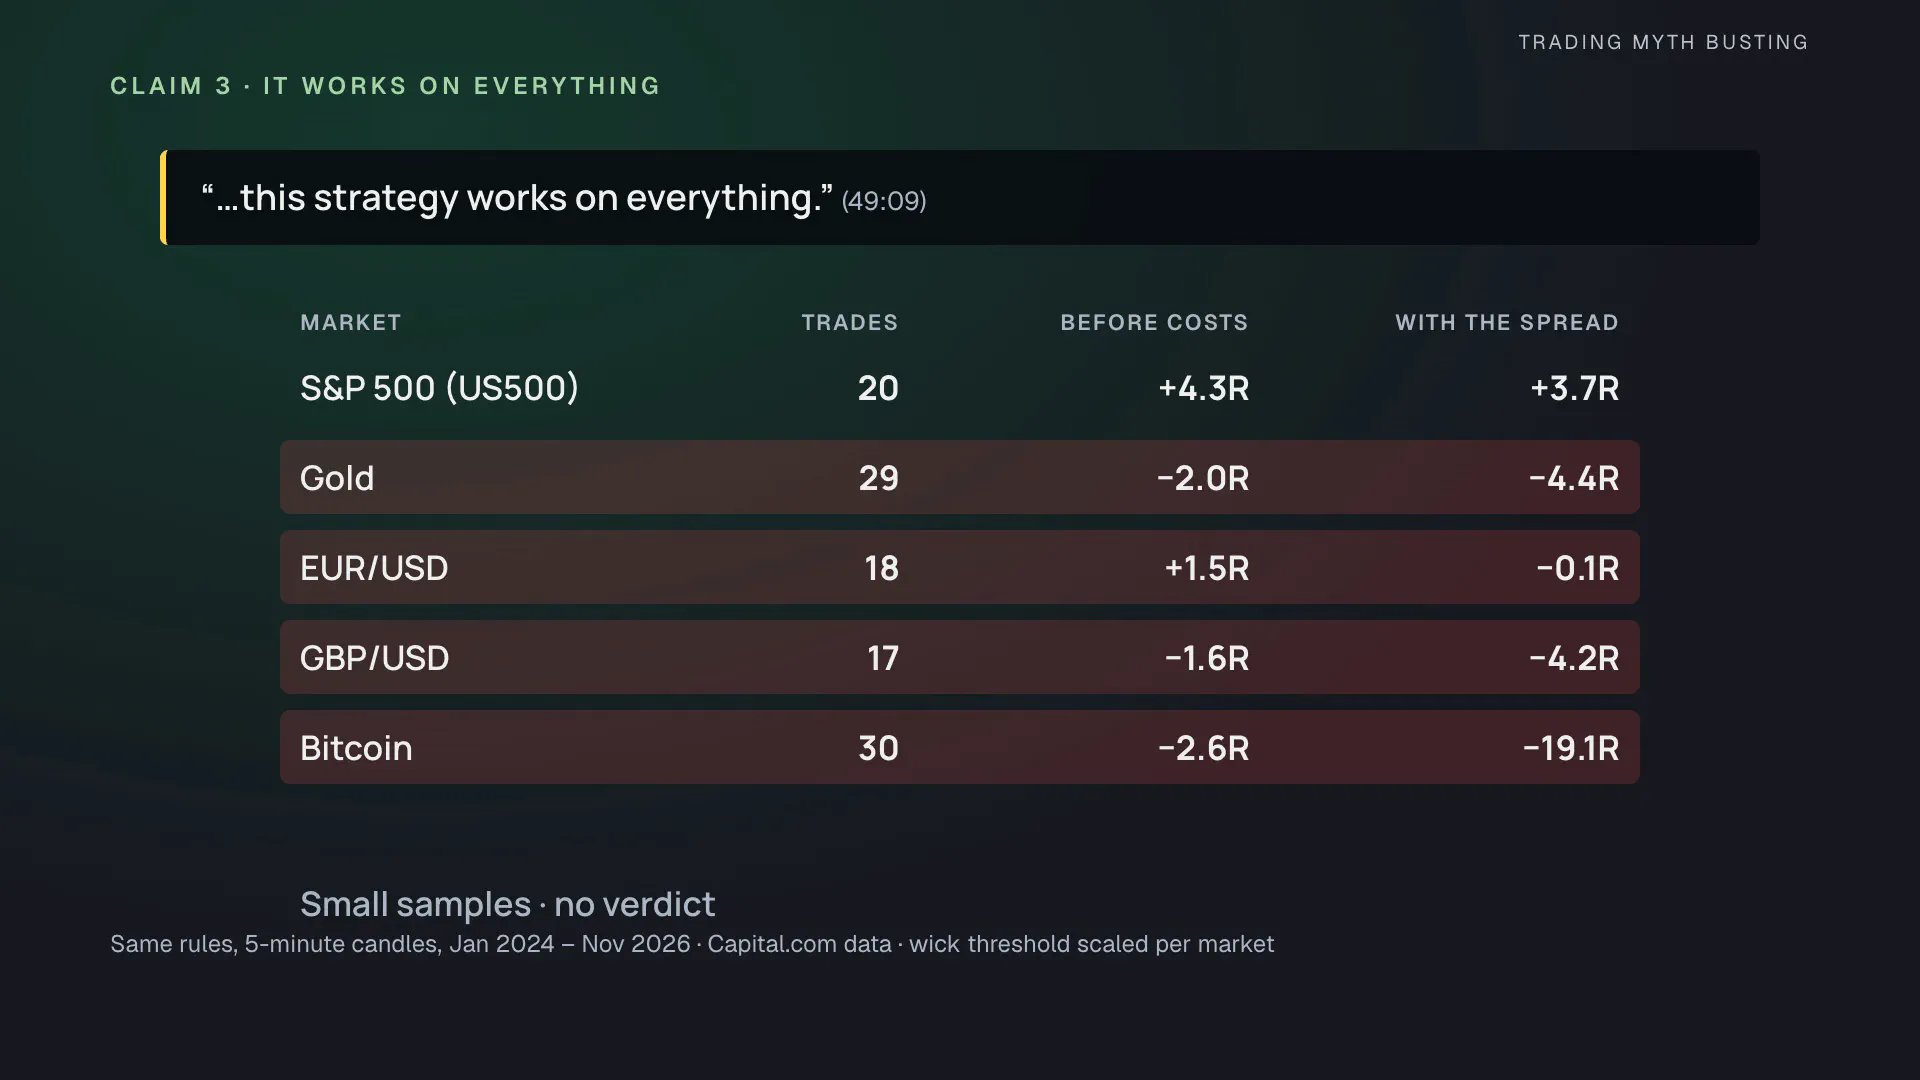
Once the spread was paid, 4 of the 5 lost money. Small samples, so no verdict. But not everything.
2 questions to ask about a win rate
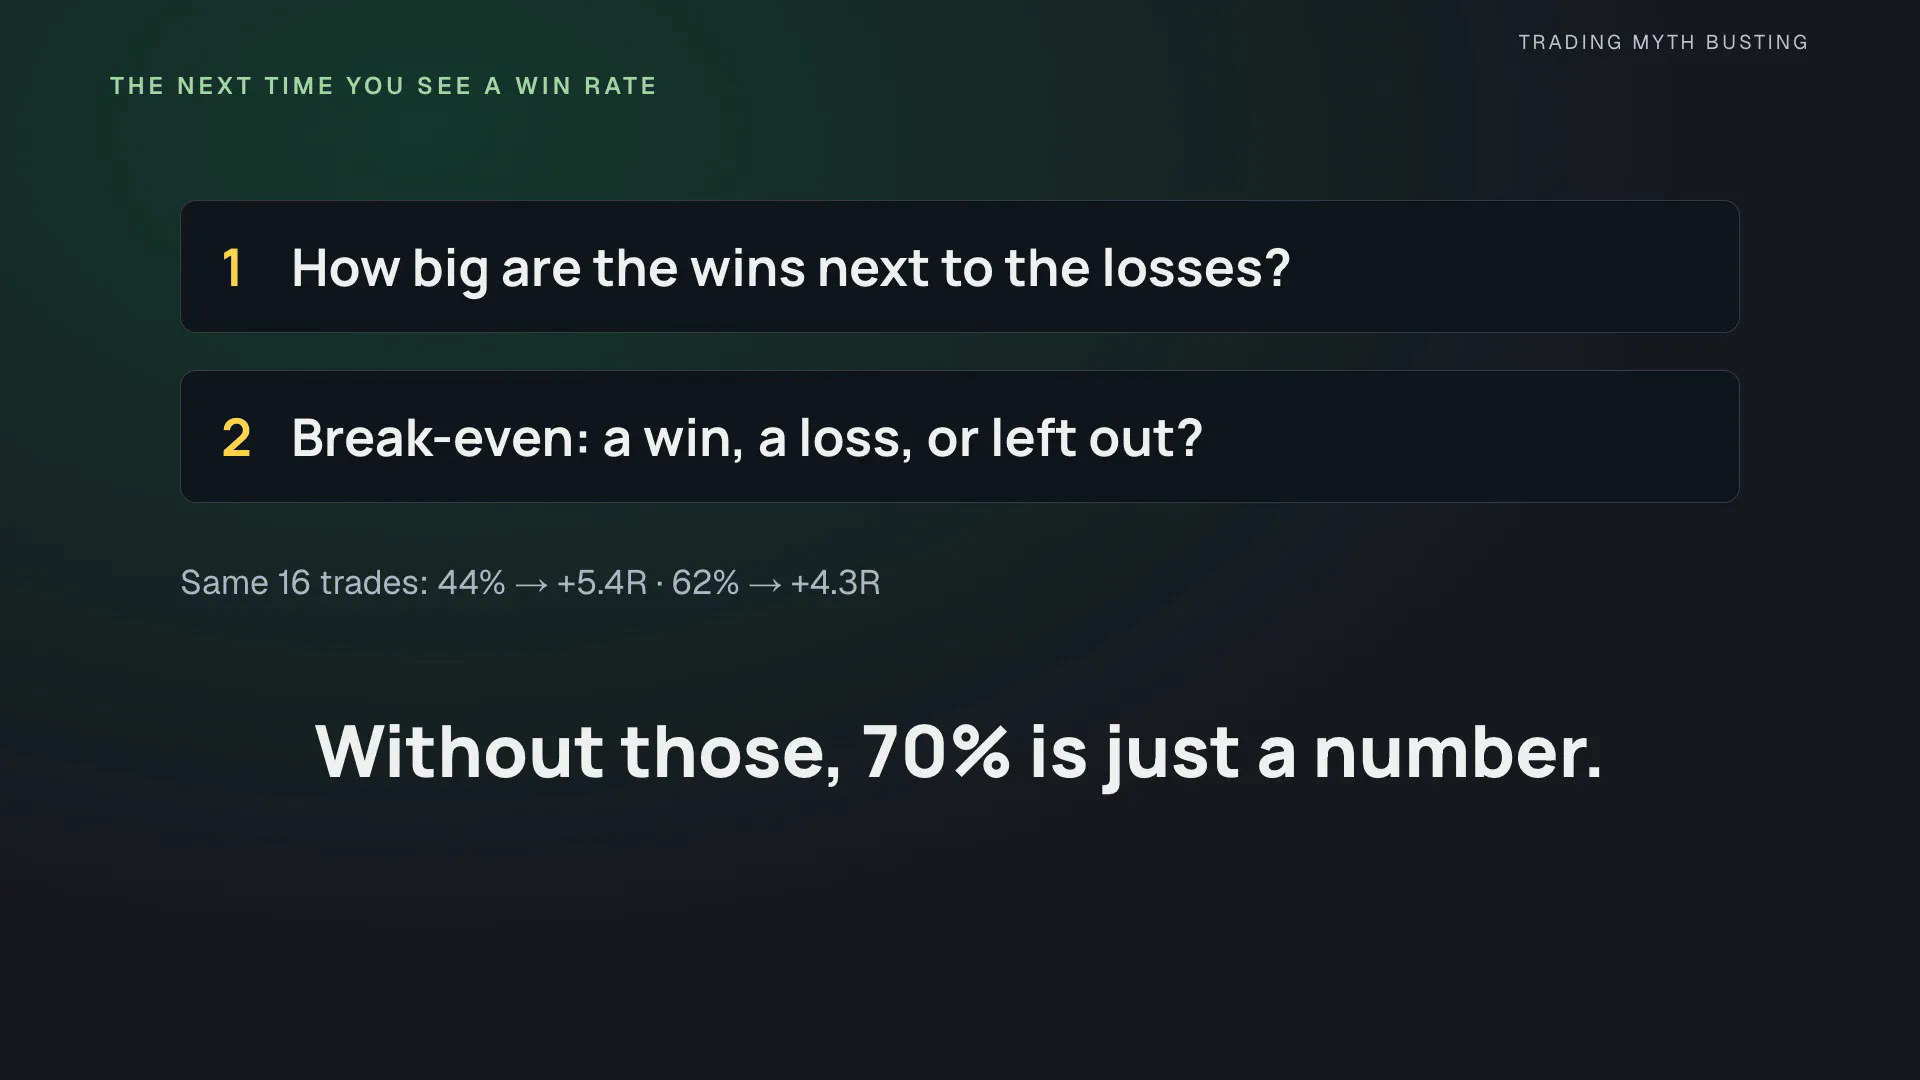
The next time someone shows you a win rate, ask 2 questions. How big are the wins next to the losses? And what happens to the trades that end at break-even: are they wins, losses, or left out? Without those 2 answers, 70% is just a number.
Exploratory runs
These runs were planned as sensitivity checks; none of them changes a verdict. Rows other than the window and the session change one rule each and keep the 9:30–10:30 window.
| Fixed 1R | Before costs: trades, win rate, total | With the spread: trades, win rate, total |
|---|---|---|
| Window to 11:30 | 46, 67.4%, +9.60R | 48, 60.4%, +5.23R |
| No 50% limit on the breakout | 111, 56.8%, +1.77R | 113, 54.0%, −4.44R |
| Any wick size | 20, 60.0%, +2.79R | 22, 54.5%, −0.21R |
| Mixed days, both directions | 53, 58.5%, +2.32R | 57, 52.6%, −3.48R |
| Long only, no bias | 48, 62.5%, +2.82R | 52, 55.8%, −3.13R |
| London open (3:00–4:00 New York) | 15, 60.0%, +1.74R | 15, 60.0%, +0.87R |
| 15-minute chart (both exits) | 0 | 0 |
- The longer window. With breakouts until 11:30, 46 trades won 67.4% before costs. We didn’t run the coin flip control on this version. His own example in the interview, September 8, 2026, breaks out at 10:30 on our data and fills at 10:40, after the one-hour window, and its level comes from a single red candle on our candles.
- The 15-minute chart. The 50% limit removes almost every breakout on 15-minute candles: even without the bias filter, only 2 trades remained; without the limit, 187.
- The candle after the breakout. He also says that after the breakout candle the next one moves as far “70% of the time” (29:42). Of the 173 breakouts in the window, the next candle was at least as big as the breakout candle 52.6% of the time (95% interval 45.2–59.9%).
Reproduce it
- The script: Two-Candle Bias Breakout, Pine source, MPL-2.0. The defaults are the rules as tested. The break-even exit, the bias variants, the minimum wick, the breakout size limit, the London open, the 120-minute window and a coin flip mode are optional research inputs. Commission and slippage are zero by default, and TradingView does not model the spread. Before publication the script ran in TradingView’s own engine on a 5-minute Capital.com US100 chart: in that period the defaults found no trade, in TradingView and in PyneCore alike, and 66 of 66 trades in 3 comparison settings matched our PyneCore runs on TradingView’s candles.
- Every trade: all-trades.csv lists every trade of the 34 registered runs that are not coin flips: the main test (both exits, with and without the bias filter, each at the chart price and with the spread), the 16 sensitivity runs, and the 10 runs on the 5 other markets. Each row has New York entry and exit times, direction, prices, the exit, the planned risk, the result in R and the spread at entry.
- The IDE in the video: PyneIDE, our IDE for Pine Script inside Visual Studio Code. It runs scripts locally on PyneCore, the open-source Pine runtime; the spread setting is a PyneCore feature that TradingView doesn’t have.
Data and assumptions. The main test uses Capital.com US100 (US Tech 100 CFD) 5-minute candles from January 2, 2024 to November 17, 2026, 742 New York trading days, with the bid and the ask side of every candle; signals and the chart price use the bid. The other markets use the same source and period. The interview’s charts come from other data feeds, so single candles can differ by a few points. R is the result divided by the planned risk, the breakout candle’s high-low range. The “with the spread” figures fill buys at the ask and sells at the bid; no commission is added. Every trade closes by 16:00 New York time, so no overnight funding applies. The coin flip runs keep every order’s price, risk and target distance and pick the direction at random, 200 full runs per exit and cost setting. The $1,000 accounts are simulated from the backtest trades with 1% risk per trade. Before the verdicts we fixed 2 script errors that the registered checks found (a trade that opened and closed inside one candle went unnoticed, and the daily candle didn’t start on the data’s first day) and replaced the indicator’s 4-hour request with candles built from the chart, as described above; the rule itself didn’t change. The discretionary parts of his trading are not modeled, so the result is about the stated rule, not about his trading. Past results don’t predict future ones.
If you get a different result, include the symbol, dates, settings and costs so we can compare the experiments.